Download presentation
Presentation is loading. Please wait.

1
CLIMAG Challenges ahead: an Indian Perspective Sulochana Gadgil, CAOS, Indian Inst. of Science, Bangalore CLIMAG 2005 WMO, Geneva

2
The beginning: Major advances in capability of predicting ENSO (important from an Indian perspective because of the known link of the Indian Monsoon with ENSO) Given the large impact of monsoon variability on agriculture, there were high expectations of using ENSO predictions for enhancing agricultural production. Development of crop models made it possible to explore the yields associated with different farming strategies for different climate scenarios and hence identify the appropriate strategies for the predicted scenario-El Nino, La Nina etc. In this talk, I briefly discuss my perspective on what has been achieved in the last decade, what are the challenges ahead and how do we address them ?

3
The beginning: Major advances in capability of predicting ENSO (important from an Indian perspective because of the known link of the Indian Monsoon with ENSO) Given the large impact of monsoon variability on agriculture, there were high expectations of using ENSO predictions for enhancing agricultural production. Development of crop models made it possible to explore the yields associated with different farming strategies for different climate scenarios and hence identify the appropriate strategies for the predicted scenario-El Nino, La Nina etc. In this talk, I briefly discuss my perspective on what has been achieved in the last decade, what are the challenges ahead and how do we address them ?

7
Mean monthly all-India rainfall Indian summer monsoon: June-September

8
Mean June- September rainfall in cm

9
Interannual Variation of the anomaly of All-India summer monsoon rainfall (as % of the mean) std dev about 10% of mean; Droughts and excess rainfall seasons-amplitude of the anomaly > 10%
 std dev about 10% of mean; Droughts and excess rainfall seasons-amplitude of the anomaly > 10%")
10
Interannual Variation of ISMR during 1979-2002

11
Interannual Variation of the Monsoon Link with ENSO: high propensity of droughts during El Nino, excess rainfall during La Nina (Sikka 1980, Rasmusson and Carpenter 1983) e.g. El Nino events of 1982, 87 were droughts (ISMR anomalies -14%,-18%) and during the La Nina of 1988 the rainfall was in excess (ISMR anomaly +12%).
 and during the La Nina of 1988 the rainfall was in excess (ISMR anomaly +12%)..")
12
Note Several droughts in the absence of El Nino e.g. 1979 1985,1986 ISMR above average (+2%) in the strongest El Nino of the century in 1997 Very large deficit in 2002 (-19%) although the El Nino was weak Excess rainfall in 88 associated with La Nina, but not that of 1994 INDIAN MONSOON AND ENSO
 in the strongest El Nino of the century in 1997 Very large deficit in 2002 (-19%) although the El Nino was weak Excess rainfall in 88 associated with La Nina, but not that of 1994 INDIAN MONSOON AND ENSO.")
13
El Nino/La Nina association with all-India summer monsoon rainfall anomalies during 1871-2001 Number of years with … Deficient monsoon Deficit>10% Normal monsoon ( -ve) Normal monsoon (+ve) Excess monsoon excess>10% Total El Nino11 4026 La Nina019818 Other1123421187 Total22355519131 (after Rupakumar et al 2002) NOTE:As many droughts with El Nino as without!
 Normal monsoon (+ve) Excess monsoon excess>10% Total El Nino La Nina Other Total (after Rupakumar et al 2002) NOTE:As many droughts with El Nino as without!")
14
Weakening link of the Indian Monsoon with ENSO During the strongest El Nino of the century in 1997 the rainfall was above average. Kumar et al (1999) suggested that the link with ENSO had weakened in the recent decades. The monsoon is also supposed to be linked with Himalayan/Eurasian Snow cover. Kumar et. al suggested that increase in surface temperatures over Eurasia favoured a stronger monsoon and hence the smaller response to El Nino events of the nineties.
 suggested that the link with ENSO had weakened in the recent decades. The monsoon is also supposed to be linked with Himalayan/Eurasian Snow cover. Kumar et. al suggested that increase in surface temperatures over Eurasia favoured a stronger monsoon and hence the smaller response to El Nino events of the nineties..")
15
All-India summer monsoon (June- September) 2002 rainfall anomaly -19% However, MONSOON 2002 turned out to be a drought
 2002 rainfall anomaly -19% However, MONSOON 2002 turned out to be a drought")
16
MONSOON 2002 The failure of the monsoon in 2002 was not anticipated, even though it was known that a weak El Nino was developing. This drought was not predicted either by empirical models or GCMs. From the experience of 1997 and 2002 it is clear that we are yet to understand completely the impact of El Nino on the monsoon.

17
Recent El Nino events: 1997 and 2002 Wake-up call Challenges

18
June-Sept 1997 ISMR anom. +2% June-Sept 2002 ISMR anom -19% Nino3.4 anom =1.93, SOI= - 4.9 Nino3.4 anom =1.02, SOI= -1.00 excess (>+20%) normal (-19 to+19%) deficit (-20% to-59%) scanty (--60% to -99%)
 normal (-19 to+19%) deficit (-20% to-59%) scanty (--60% to -99%).")
19
Experience of the 1997 El Nino- Zimbabwe “ Following the evolution of the strong El Nino event of 1997 a forecast for a high probability of low rainfall was issued for the whole of eastern and southern Africa as early as September 1997.Memories of the devastating droughts associated with the El nino events of 1982-83 and 1991-92 resulted in most people preparing for the worst possible drought in southern Africa.

20
Strategies appropriate for low rainfall worked for the southern parts of the country where the rainfall was low.However, for the northern areas, the season turned out average to above average and some opportunities were missed ……….Feedback from farmers shows that there is intense regret for a loss incurred because one changed decisions as a result of the forecast. ” Unganai, 2000

21
Australia also experienced a far more severe drought in 2002 than in 1997 aaa

23
from

24
Thus, there are major differences in the impact of different El nino events on rainfall (and hence agriculture) over Australia, India. Over Australia, the differences in impact of wheat yields (bio-indicator) arise from differences in spatial patterns of rainfall anomalies and time of onset of the event (Pottgeiter, Hammer, Meinke, Stone and Goddard J Climate (under review). They have identified three types of El Nino events (with 1997,2002 in separate groups). Hence need to predict not only the occurrence and intensity of the El Nino but the type as well.
 arise from differences in spatial patterns of rainfall anomalies and time of onset of the event (Pottgeiter, Hammer, Meinke, Stone and Goddard J Climate (under review). They have identified three types of El Nino events (with 1997,2002 in separate groups). Hence need to predict not only the occurrence and intensity of the El Nino but the type as well..")
25
Impact of the variability of the MONSOON RAINFALL still significant despite the Green revolution (has become more in the last decade due to the fatigue of the green revolution)
")
26
Impact of monsoon of 2002

27
Impact of the monsoon of 2002

28
COMPARISON WITH 2003 Fortunately, the monsoon of 2003 turned out to be far better (all India monsoon rainfall 2% above average). In particular, whereas there was an unprecedented deficit of 49% in all-India rainfall, in July 2003 there was excess of 7%. Comparison of the OLR anomaly patterns for July 2002,2003 is revealing.

29
Impact of the Monsoon of 2003

30
OLR and OLR anomaly patterns for July 2002 and 2003

31
METEOSAT image at 00z15Jun2003 Convection over eastern Arabian Sea and western parts of Indian Ocean is linked to convection over the western equatorial Indian Ocean

32
OLR and OLR anomaly patterns for August 1986 and July 1994

33
LINK TO EQUATORIAL INDIAN OCEAN CONVECTION OVER EASTERN ARABIAN SEA AND WESTERN PART OF THE INDIAN REGION IS : POSITIVELY CORRELATED.W.R.T. CONVECTION OVER THE WESTERN EQ. IND (WEIO :50-70E,10S-10N) AND NEGATIVELY CORRELATED WITH EASTERN EQ IND OCEAN (EEIO:90-110E, 0-10S);
 AND NEGATIVELY CORRELATED WITH EASTERN EQ IND OCEAN (EEIO:90-110E, 0-10S);.")
34
Convection and Wind anomaly patterns suggest When the convection over WEIO is enhanced, convection over EEIO is suppressed. Associated with this, equatorial wind anomalies also changes direction; which suggests changes in sea level pressure gradient. We call this oscillation as Equatorial Indian Ocean Oscillation (EQUINOO). EQUINOO is the atmospheric component of Indian Ocean Dipole also called the Indian Ocean Zonal mode(Saji et al. 1999, Webster et al. 1999) We use EQWIN an index of EQUINOO, defined as the negative of the anomaly of the surface zonal wind averaged over 60E-90E:2.5S-2.5N, normalized by its standard deviation.
. EQUINOO is the atmospheric component of Indian Ocean Dipole also called the Indian Ocean Zonal mode(Saji et al. 1999, Webster et al. 1999) We use EQWIN an index of EQUINOO, defined as the negative of the anomaly of the surface zonal wind averaged over 60E-90E:2.5S-2.5N, normalized by its standard deviation..")
35
We focus on the links between the monsoon and atmospheric convection/circulation rather than SST In the coupled system SST, OLR, wind are all interrelated. However, often the SST responds to changes in OLR, wind and there are lags.

36
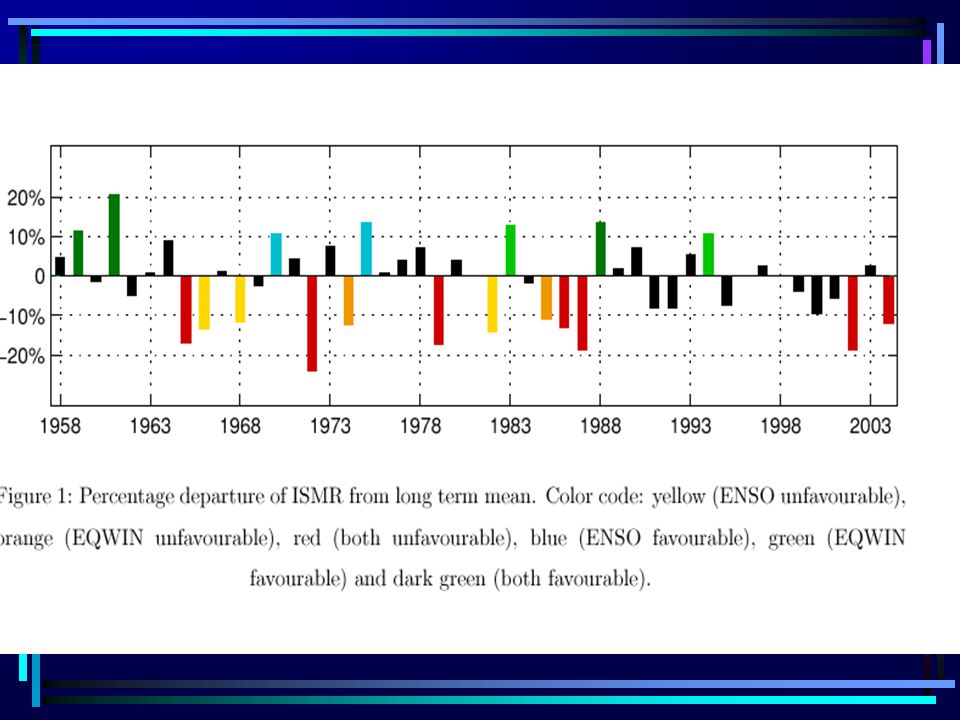
Extremes (i.e. with magnitude of the anomaly> one std. dev which is 10%of the mean ) of the Indian Summer Monsoon Rainfall during 1979-2003 EQWIN: Index of EQUINOO defined as anomaly of the zonal wind averaged over central equatorial Indian Ocean (60-90E, 2.5S-2.5N); ENSO index is the negative of Nino 3.4 index
 of the Indian Summer Monsoon Rainfall during EQWIN: Index of EQUINOO defined as anomaly of the zonal wind averaged over central equatorial Indian Ocean (60-90E, 2.5S-2.5N); ENSO index is the negative of Nino 3.4 index.")
39
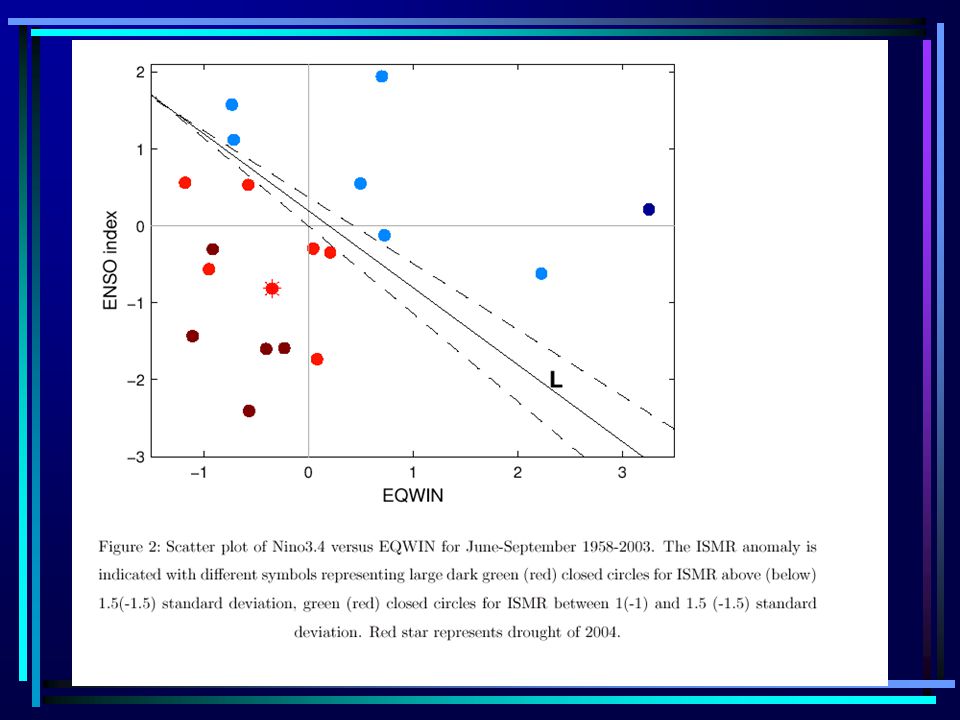
Strong relationship between large anomalies of ISMR and a composite index which is a linear combination of the indices for ENSO and EQUINOO with all seasons with large deficits (excess) characterized by small (large) values of the index Gadgil et al 2004 GRL
 characterized by small (large) values of the index Gadgil et al 2004 GRL")
40
During El Nino (La Nina) the convection over the entire equatorial Indian Ocean gets suppressed (enhanced) whereas during negative (positive) phases of EQUINOO the convection over the EEIO is enhanced (suppressed) and WEIO suppressed (enhanced ). Extremes of the Indian Monsoon are thus determined by the intensity and phases of two modes: ENSO and EQUINOO. Thanks to the efforts over the TOGA-CLIVAR period, simulation of ENSO and its links with the Indian monsoon is now possible e.g. AMIP results for the 1987 /88 El Nino /La Nina events.

41
OLR anomaly patterns for El Nino (July 1987) and La Nina (August 1988) El Nino La Nina
 and La Nina (August 1988) El Nino La Nina")
42
1988 AMIP results

43
However when the extremes are not associated with ENSO (e.g. 1994) what happens?
 what happens")
44
1994

45
Prediction of all-India summer monsoon rainfall-ISMR 1. With GCMs/coupled models: a lot of work went into making realistic simulations of the 1987/88 El Nino (drought) and La Nina (excess rfl) events. Now a large number of models can simulate these, if observed SST is used as boundary condition-AMIP results. However the same cannot be said about EQUINOO events. Need more R&D in modelling to achieve that. 2. Empirical models
 and La Nina (excess rfl) events. Now a large number of models can simulate these, if observed SST is used as boundary condition-AMIP results. However the same cannot be said about EQUINOO events. Need more R&D in modelling to achieve that. 2. Empirical models.")
46
Can we predict the evolution of EQUINOO? Observations of the evolution of the equatorial wind before two major EQUINOO events suggests that it may be possible.

47
Anomalies of the zonal component of surface wind along the eq.

48
Empirical models Generally based on correlations with various factors including those related to ENSO. Most models assume linear relationships. However, the relationships are seldom linear. e.g. with SOI, NINO3.4 SST, Eurasian snow cover

49
Note that when the SSTanom. Over NINO3.4 1 there are no floods However for values in between very little can be said.

50
Signal clearSignal clear Signal clear only for SOI>1 clearclear

51
Signal clear only for –ve anomaly

52
Signal only for SOI>1 when no drough ts occur

53
Signal only for Nino3.4 index >1 when no floods occur

54
Empirical model Predictions Even when the correlation is reasonable, it is important to look at the actual relationship and generate predictions only when the values of the parameter are in the appropriate range.

55
Application of CLIVAR Science ? Approach: Do we try and apply what we can predict (e.g.ENSO) or try and predict what is needed?
 or try and predict what is needed .")
56
What are the decisions of stakeholders which depend on information/prediction of climate variability and which facets of climate variability (which events) are involved in these decisions? In other words, what are the events that need to be predicted? Can we predict them?

57
Example of useful predictions on the seasonal-to-interannual scale Most of the studies of the impact of climate variability tend to emphasize droughts which have a large negative impact.. Prediction of seasons with good rainfall more useful than those of droughts.

59
Yield gap –gap between the yield at the agri. station and the yield on farms or the district average yield Yield gap is large for good rainfall years but almost zero for poor rainfall years In fact farmers also do not use the recommended levels of fertilizers because there is benefit only in good rainfall years. They are therefore reluctant to and spend on fertilizers in the absence of reliable predictions for a good rainfall season.. It thus appears that focussing on a good rainfall year would be more useful.

60
APPLICATION FOR AGRICULTURE Knowledge/prediction of climate variability could be useful if and only if it has an impact on decision-making of stakeholders (farmers,policymakers etc)
")
61
The approach used - SYSTEM (END-TO- END) APPROACH for linking decisions to climate variability involves crop models Crop models have now reached a stage of development at which realistic simulations of the response to climate variability for some crops are possible.
 APPROACH for linking decisions to climate variability involves crop models Crop models have now reached a stage of development at which realistic simulations of the response to climate variability for some crops are possible.")
62
Farm level decisions Scenario of different options Climate variability (historical data) or prediction Crop models (validated for the crop variety and the region ) Variation of yield/profit with choice of option Note that farm-level decisions come on top
 or prediction Crop models (validated for the crop variety and the region ) Variation of yield/profit with choice of option Note that farm-level decisions come on top")
63
Use of crop models for identifying appropriate farming strategies I consider examples of applications for farming strategies appropriate for (i) seasonal predictions-cultivation of cotton in Australia (ii) rainfall variability experienced - rainfed cultivation of Peanuts in semi-arid parts of India
 seasonal predictions-cultivation of cotton in Australia (ii) rainfall variability experienced - rainfed cultivation of Peanuts in semi-arid parts of India")
64
Australian Experience There has been a rich experience of interaction among researchers, advisors (public and private) and farmers in the development of the use of seasonal forecasting in management of the farming systems in Australia. (Hammer et al 1991)
.")
65
This involved simulation analyses of scenarios for crop management, giving expected outcome distributions for sets of historical analogue years This approach was built on a history of development and use of crop modelling and simulation as a general means to support decisions in the highly variable environment

66
Simulated gross margin (average for 1887-1992) for cotton grown using different row configurations at Dalby, Queensland from Hammer 2000
 for cotton grown using different row configurations at Dalby, Queensland from Hammer 2000")
67
The large impact of monsoon variability on Indian agricultural production (and hence the economy) has been known for decades and is generally mentioned as the reason for studies aimed at understanding monsoon variability ( and funding). However, until the last decade, there have been hardly any attempts to figure out how this understanding could be used for mitigating the impact or enhancing agricultural production.

68
The green revolution strategies of cultivation of new varieties with high dose of fertilizers under irrigated conditions did not work in rainfed conditions and it became clear that the variability of climate has to be of taken into account in identifying farming strategies

69
Need for identifying startegies which are appropriate for the Climate Variability experienced The strategies recommended by agricultural scientists were found to be inappropriate by the farmers, in many cases. This is because, the strategies recommended, even for rainfed regions, were often derived without taking into account the variability of climate. Thus for rainfed regions (which will always remain a substantial fraction of the cultivated area) identification of farming strategies which are tailored to the climate variability of the region is even today a very important problem
 identification of farming strategies which are tailored to the climate variability of the region is even today a very important problem.")
70
Need for identifying strategies that are appropriate for the Climate Variability experienced Since the 70s large number of new varieties and crops were introduced.Unlike for the traditional crops, the farmers do not have enough experience to understand the impact of climate variability on these crops/varieties and evolve the optimum strategies.

72
PEANUT- GRO MODEL VALIDA- TION FOR ANATAPUR Singh et al 1994

73
Variation with planting date for the rainfall patterns of 90 years

77
Critical stage at which lack of rain has a large impact on the yield-pod filling stage which is 30-50 days after planting This result can also be verified using observations

78
Are the crop models good enough?

79
Lessons More work required to develop GCMs to achieve realistic simulation of the link of the Indian monsoon to EQUINOO and generate better predictions of the interannual variation of the Indian monsoon. Improvement of empirical models needed Validation of crop models needs to be done on a larger scale-perhaps also CMIP for major crops

80
Farmer involvement Essential to have a participatory (rather than top- down) approach to the farmers Important to first derive strategies for the climate variability of the region,encourage the farmers to test out the recommended strategies Involve them in testing the skill of the available predictions and encourage them to make only those decisions which are not associated with large losses in case the predictions go wrong Farmers need to be educated on strategies derived from climate variability information. They appear to be more keen more keen on using forecasts for decision making. It is essential to assess the skill of forecasts for their region-perhaps by generating forecasts for the last 10/20 years and analysing them in collaboration with the farmers

Similar presentations


 –Tropical Pacific: El Nino/Southern Oscillation –Southern Ocean.>")


