Download presentation
Presentation is loading. Please wait.

1
Solar Image Processing: A Multiscale View C. Alex Young NASA/GSFC C. Alex Young NASA/GSFC UCLA - IPAM (January 28, 2004)
.")
2
Outline My motivations - where I got interested in multiscale methods. A gallery of data. A standard analysis - that surprised me. My approach - an attempt at something better. Some other problems. My motivations - where I got interested in multiscale methods. A gallery of data. A standard analysis - that surprised me. My approach - an attempt at something better. Some other problems.

3
Outline My motivations - where I got interested in multiscale methods. A gallery of data. A standard analysis - that surprised me. My approach - an attempt at something better. Some other problems. My motivations - where I got interested in multiscale methods. A gallery of data. A standard analysis - that surprised me. My approach - an attempt at something better. Some other problems.

4
The high energy sun. 20 Jan 2000 Solar Flare BATSE and COMPTEL (yellow) 1-30 MeV image and 100 keV /1-30 MeV lightcurves
 1-30 MeV image and 100 keV /1-30 MeV lightcurves.")
5
The EUV/radio sun. Flare in EUV 171 Å pass band Flare in radio

6
Outline My motivations - where I got interested in multiscale methods. A gallery of data. A standard analysis - that surprised me. My approach - an attempt at something better. A suggestion by J. Starck Some other problems. My motivations - where I got interested in multiscale methods. A gallery of data. A standard analysis - that surprised me. My approach - an attempt at something better. A suggestion by J. Starck Some other problems.

7
From the photosphere to the corona.

8
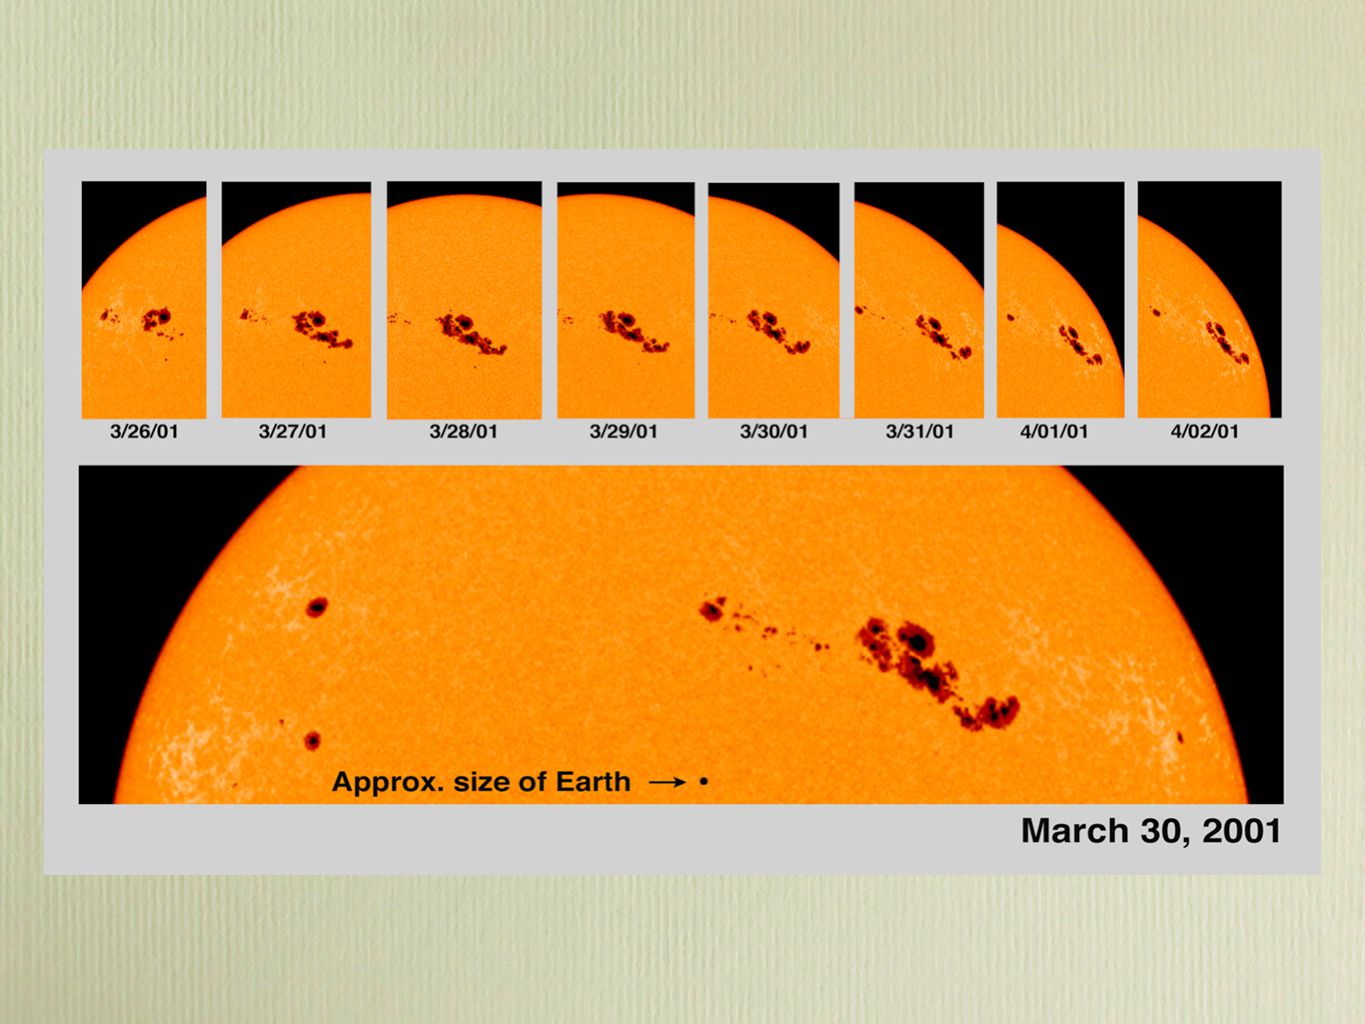
The visible sun.

9
Sunspot evolution.

10
Swedish Vacuum Telescope.

12
Solar flare quake.

13
Solar oscillations.

14
Oscillations in the MDI high-res. f.o.v.

15
Helioseismology.

16
Sub-surface structure.

17
Backside imaging.

18
Longitudinal Magnetic field

20
304 Å Sun

24
195 Å Sun

26
195 Å difference image of an EIT wave

27
Solar flare in UV cont. and 2 EUV passbands seen by TRACE

28
Filament eruptions in TRACE 171 Å passband

29
Magnetic loops in TRACE 171 Å passband

30
A flare in TRACE 1600 Å cont. and 171 Å pass band

31
Solar tornados

32
Largest flare ever recorded in 171 Å pass band.

34
The outer corona seen in white-light by LASCO C2 2-15 solar radii The outer corona seen in white-light by LASCO C2 2-15 solar radii

35
LASCO C3 7-30 solar radii

36
Active sun seen in LASCO C3

37
Outline My motivations - where I got interested in multiscale methods. A gallery of data. A standard analysis - that surprised me. My approach - an attempt at something better. Some other problems. My motivations - where I got interested in multiscale methods. A gallery of data. A standard analysis - that surprised me. My approach - an attempt at something better. Some other problems.

38
TRACE 195 A

40
Images at the time of the first brightening in the TRACE movie. (Gallagher 2003) Top panels: TRACE 195 Å difference images created by subtracting each image from a frame taken at 00:42:30 UT. Bottom panels: LASCO C2 and C3 images showing the similar morphology of the eruption as it propagates away from the solar surface. (Gallagher 2003)
 Top panels: TRACE 195 Å difference images created by subtracting each image from a frame taken at 00:42:30 UT. Bottom panels: LASCO C2 and C3 images showing the similar morphology of the eruption as it propagates away from the solar surface. (Gallagher 2003).")
41
A Standard Analysis

42
Outline My motivations - where I got interested in multiscale methods. A gallery of data. A standard analysis - that surprised me. My approach - an attempt at something better. Some other problems. My motivations - where I got interested in multiscale methods. A gallery of data. A standard analysis - that surprised me. My approach - an attempt at something better. Some other problems.

43
scale = 2 scale = 4 scale = 8 scale = 16

44
The top image shows the 30 multiscale edges at scale 8 (green) and 16 (red) over the image at 00:46:34 UT. The bottom images zoom in on the fronts. The top image shows the 30 multiscale edges at scale 8 (green) and 16 (red) over the image at 00:46:34 UT. The bottom images zoom in on the fronts. A set of edges from 00:46:34 UT to 01:01:58 UT at 2 scales
 and 16 (red) over the image at 00:46:34 UT. The bottom images zoom in on the fronts. A set of edges from 00:46:34 UT to 01:01:58 UT at 2 scales.")
45
Following a front in TRACE.

46
Outline My motivations - where I got interested in multiscale methods. A gallery of data. A standard analysis - that surprised me. My approach - an attempt at something better. Some other problems. My motivations - where I got interested in multiscale methods. A gallery of data. A standard analysis - that surprised me. My approach - an attempt at something better. Some other problems.

47
high-energy solar flare imaging

49
Sunspot Classification Multifractal measure ? Shapelets ?

50
EIT Calibration calibration lamp for flat field and filter grid. Wavelets, Ridgelets, and Curvelets representation?

51
EIT 284 Å images Cosmic Rays, Bright Points, Coronal Holes.

52
Large increase in data volume. 1 passband x 136 images x (1 Mb) = 136 Mb 4 passbands x 1440 images x (16.6 Mbs) = 95.6 Gbs 1 passband x 136 images x (1 Mb) = 136 Mb 4 passbands x 1440 images x (16.6 Mbs) = 95.6 Gbs Data from just EUV imaging Data from the entire spacecraft increases from ~1 Gbyte/day to ~1 Tbyte/day
 = 136 Mb 4 passbands x 1440 images x (16.6 Mbs) = 95.6 Gbs 1 passband x 136 images x (1 Mb) = 136 Mb 4 passbands x 1440 images x (16.6 Mbs) = 95.6 Gbs Data from just EUV imaging Data from the entire spacecraft increases from ~1 Gbyte/day to ~1 Tbyte/day.")
53
The sun in STEREO Tomography in space, reconstructing a 3-D view with two spacecraft

Similar presentations


 Clare E Parnell School of Mathematics and Statistics.>")


>")
