Download presentation
Presentation is loading. Please wait.

1
Social Network Analysis of the Farm to Plate Network, 2011-2012
Drake Turner and Christopher Koliba, Ph.D. University of Vermont April 2013

2
Research Objective How is the Farm to Plate Network structured?
Does this structure create value for member organizations? Funded through the James M. Jeffords Policy Research Center

3
Network Analysis and Food Systems
How is network analysis applied to the food system? Biology – study of food chains …and not much else ? = +

4
Research Question and Hypotheses
RQ – How is the Farm to Plate Network structured on a governance level? How is it structured on an operational level? How do these structures compare to one another? H1 – The Farm to Plate Network increases and strengthens the connectivity of member organizations in the farm and food sector in Vermont. H2 – Farm to Plate Network member organizations tend to favor the exchange of information over the exchange of human resources in service of joint programs and projects and the exchange of financial resources. H3 – Government organizations, nonprofits, and academic organizations participate in the governing and operation of the Farm to Plate Network more centrally than for-profit or funder organizations.

5
Methods Online Survey SPSS ORA/UCINET
Sent to representatives from all organizations in total network (212 organizations) 16 Questions about: Organization demographics Association with Farm to Plate Goals Assessment of impacts of network membership Collaboration with other network members Information Sharing, Project/Program Collaboration, Resource Sharing 85 organizations responded SPSS Demographic information, goals, and assessment of impacts Crosstabs and frequency statistics ORA/UCINET Governing network – meeting minutes Operational network – collaboration data from survey Network maps and centrality measures Mention multiple responses from some organizations – averaged responses
 16 Questions about: Organization demographics. Association with Farm to Plate Goals. Assessment of impacts of network membership. Collaboration with other network members. Information Sharing, Project/Program Collaboration, Resource Sharing. 85 organizations responded. SPSS. Demographic information, goals, and assessment of impacts. Crosstabs and frequency statistics. ORA/UCINET. Governing network – meeting minutes. Operational network – collaboration data from survey. Network maps and centrality measures. Mention multiple responses from some organizations – averaged responses.")
6
Total Network N=212 Governing Network n=142 Sampled Network n=85
Number Percent Non-Profit 97 46% 67 47% 41 48% For-Profit 62 29% 30 21% 16 19% Academic 7% 13 9% 11 13% Funder 6% 10 8 Government 25 12% 22 16% 9 11% Total Network N=212 Governing Network n=142 Sampled Network n=85

7
Results H1 – The Farm to Plate Network increases and strengthens the connectivity of member organizations in the farm and food sector in Vermont. “Our organization has formed new relationships in the past year as a direct result of our involvement in the Farm to Plate Network.” (n=85) Membership in network has helped our organization to advance our own organization’s goals We have formed new relationships as a result of the Farm to Plate Network We have strengthened existing relationships as a result of the Farm to Plate Network
 Membership in network has helped our organization to advance our own organization’s goals. We have formed new relationships as a result of the Farm to Plate Network. We have strengthened existing relationships as a result of the Farm to Plate Network.")
8
“Our organization’s involvement in the Farm to Plate Network has helped strengthen our existing relationships.” (n=85) “The Farm to Plate Network is helping our organization to advance our organization’s own goals.” (n=85)
")
9
Social Network Analysis Terms
Node Tie Density Centrality Degree Betweenness Eigenvector Density – the proportion of direct ties in a network relative to the total number possible Degree – measures the number of connections each node has – measures activity and visibility in a network Betweenness – measures the importance of a node in terms of connecting other nodes – assesses brokerage Eigenvector – measures how important/central a node’s connections are

10
Issues confronting the network:
Key to success lies in the capacity of the network to be self-sufficient Difficulties in getting organizations to operate in a networked way Public-private partnership struggles (examined later) Source: Farm to Plate Annual Report, 2012
 Source: Farm to Plate Annual Report,")
11
F2P Governing Network

12
Governing Network – Number of Meetings Attended by Sector (n=142)
F2P Governing Network Governing Network – Number of Meetings Attended by Sector (n=142) Governing Network – Number of Meetings Attended by Organization (n=142)
 Governing Network – Number of Meetings Attended by Organization (n=142)")
13
Sampled Network – Information Sharing

14
Sampled Network – Program/Project Collaboration

15
Sampled Network – Resource Sharing

16
Sampled Network – Network Level Measures
Results Sampled Network – Network Level Measures

17
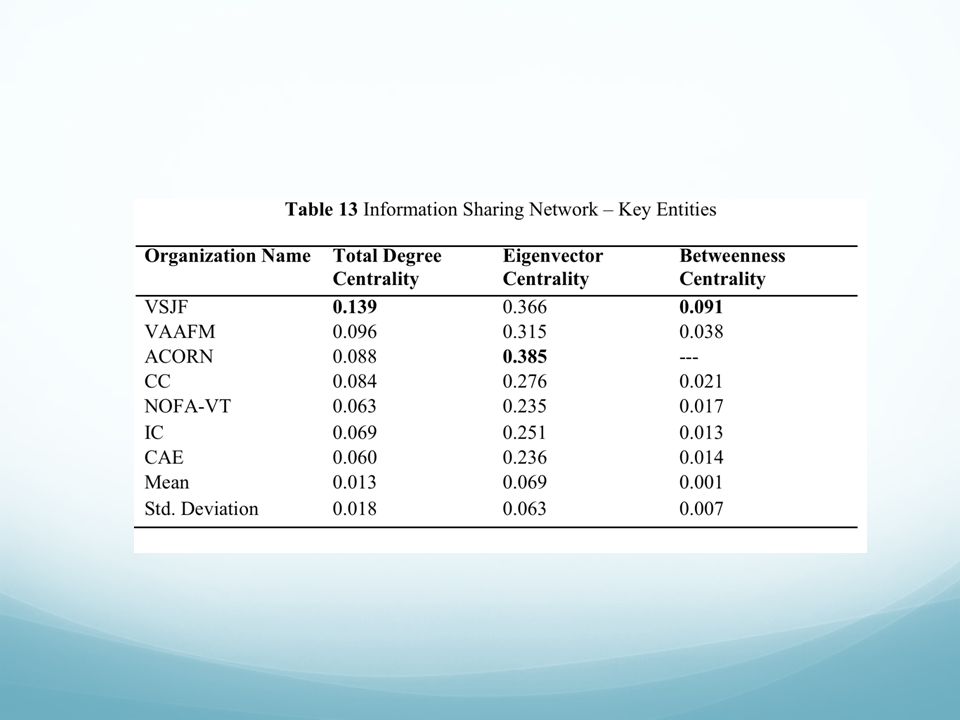
Sampled Network – Information Sharing

19
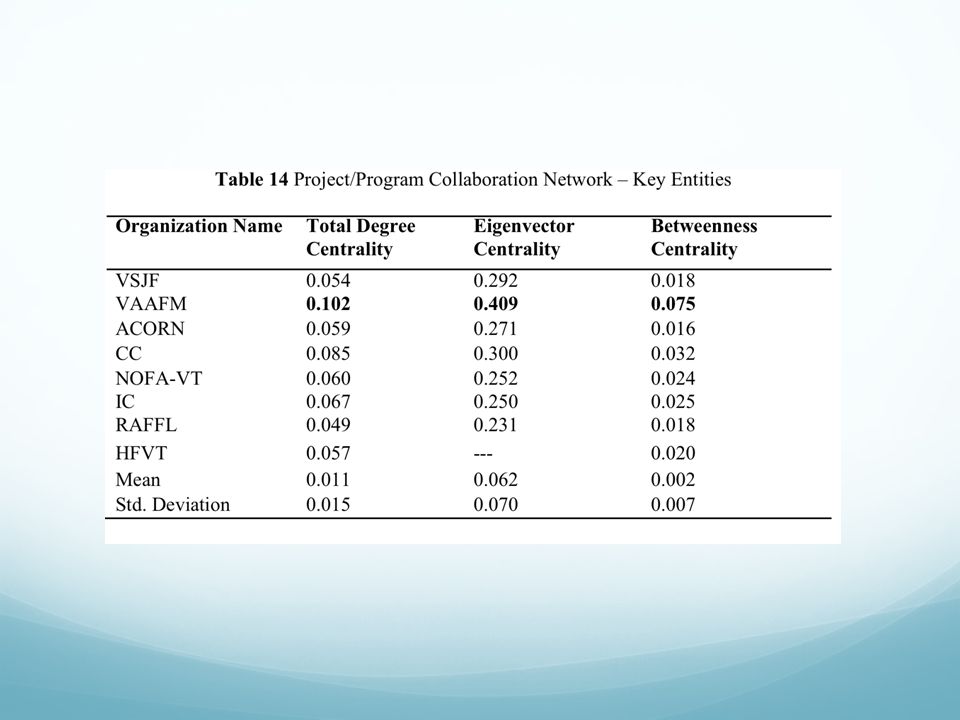
Sampled Network – Project/Program Collaboration

21
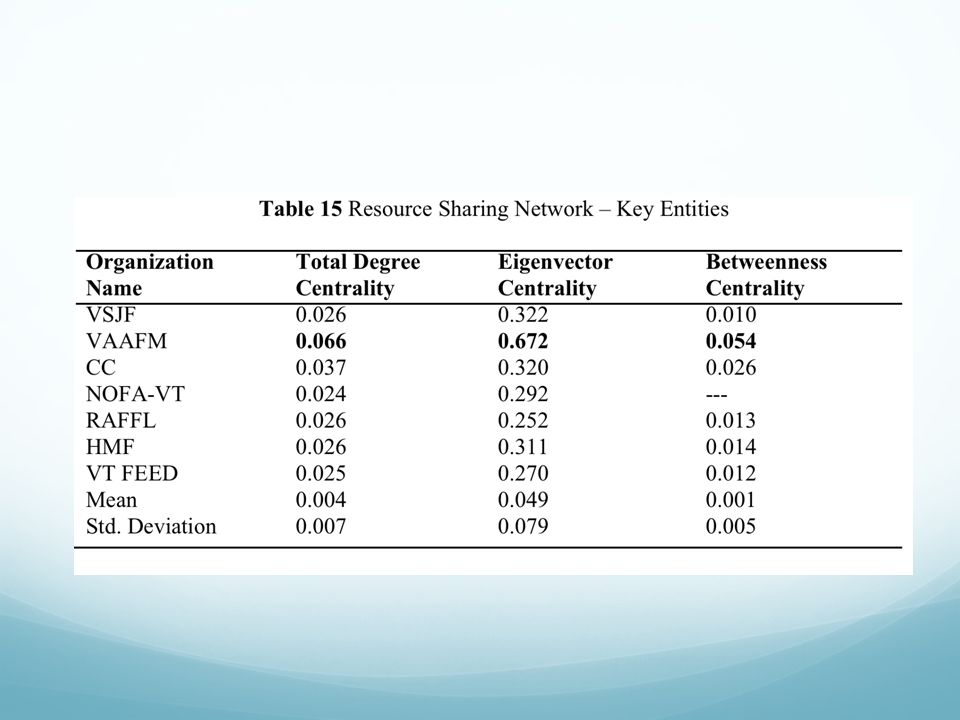
Sampled Network – Resource Sharing

24
Discussion: Limitations Calls for Future Research
Missing data Response validity Calls for Future Research Baseline study Implications for Practice Network Managers Network Members Outsiders Network Managers – concrete feedback in relation to perceptions of value of network membership Network Members – members are able to visualize their positionality in the network – can see gaps in their relationships and opportunities for improvement Outsiders – opportunity to understand the structure and scope of the network, and find leverage points and opportunities for entry

25
Next steps: Generate peer review articles
Issue a final report to F2P Network summarizing these findings Link survey results to Atlas Continue to analyze data, particularly around goal-specific network configurations. Possibly continue to provide information back to the F2P network Conduct network survey every two years to track the evolution of the network over time Access data from the Atlas to develop a data analytics profile of website users– connecting these results to network analysis– in collaboration with VSJF and others…

26
Thank you!

27
Sources Campbell, M.C. (2004). Building a common table: the role for planning in community food systems. Journal of Planning Education and Research, 23: Clancy, K. (2004). Potential contributions of planning to community food systems. Journal of Planning Education and Research, 23 (4): Farm to Plate Annual Report, 2011. Farm to Plate Annual Report, 2012. Kania, J., and Kramer, M. (2011). Collective impact. Stanford Social Innovation Review, Winter 2011: Koliba, C., Campbell, E., and Davis. (2011). Food System Diagram. Koliba, C., Meek, J., and Zia, A. (2011). Governance Networks in Public Administration and Public Policy. Boca Raton: CRC Press. Prell, C. (2012). Social Network Analysis: history, theory, and methodology. London: Sage Publications.
. Building a common table: the role for planning in community food systems. Journal of Planning Education and Research, 23: Clancy, K. (2004). Potential contributions of planning to community food systems. Journal of Planning Education and Research, 23 (4): Farm to Plate Annual Report, Farm to Plate Annual Report, Kania, J., and Kramer, M. (2011). Collective impact. Stanford Social Innovation Review, Winter 2011: Koliba, C., Campbell, E., and Davis. (2011). Food System Diagram. Koliba, C., Meek, J., and Zia, A. (2011). Governance Networks in Public Administration and Public Policy. Boca Raton: CRC Press. Prell, C. (2012). Social Network Analysis: history, theory, and methodology. London: Sage Publications.")
Similar presentations


 Drake University.>")

