Download presentation
Presentation is loading. Please wait.

1
Cardiac Cycle : Electrical and Mechanical Events
Dr Manisha Desai University College of Medical Sciences & GTB Hospital, Delhi

2
CARDIAC CYCLE The cardiac events that occur from the beginning of one heart beat to the beginning of the next. Events : Electrical Mechanical Electrical and mechanical events occur in a co-ordinated manner to generate effective contractions Duration – 0.8 s

3
ELECTRICAL EVENTS The rhythmical activity of the heart is controlled by electrical impulses A specialised conduction system generates and propagates impulses Cardiac muscle as a functional syncitium enables rapid and uniform passage of the impulses Ensures : all parts of the ventricle contract simultaneously. atrial contraction → 1/6th sec before ventricular contraction

4
CONDUCTION SYSTEM

5
SAN AVN LBB RBB LAF LPF PURKINJE SYSTEM BUNDLE OF HIS Myocardium
ANT I/N TRACT OF BACHMAN MIDDLE I/N TRACT OF WENCKEBACH POST I/N TRACT OF THOREL AVN BUNDLE OF HIS LBB RBB LAF LPF PURKINJE SYSTEM Myocardium

6
SINOATRIAL NODE Junction of SVC with right atrium
Specialised neurocardiac tissue ; almost no contractile muscle filament Normal pacemaker Connects directly with the surrounding atrial muscle fibres so that action potential generated spreads immediately into the atrium. Properties of Self- excitation and Rhythmicity

7
What causes the self excitation?
Membrane in natural state permeable to Na and Ca ions RMP in SA nodal fibre is less negative : -60 to -70 mv This voltage closes fast Na channels but slow Na - Ca channels are open The ions flow inward → membrane permeability further increased → Threshold reached → Action potential

8
Half way through the action potential, slow Na-Ca channels begin to close. K channels open for a prolonged period Inside of the membrane becomes more negative = HYPERPOLARIZATION This persists for 0.5s after the Action potential ends The K conductance weans off → RMP reached → Na –Ca opening overbalances K closure → threshold for Action potential→ Action potential

9
SINO ATRIAL NODE Self–excitation & AP Recovery of AP Resting Memb Potential Hyperpolarisation

10
Conduction through the other parts
From SAN impulses through the 3 bands (1m/s) and atria (0.3m/s) Delay in the AVN – of 0.09 s. Due to reduced gap junction number. Allows time for the ventricles to fill completely before they contract Rapid transmission through Purkinje fibres (4m/s) due to many gap junctions Transmission in ventricular muscle- 0.3 – 0.5m/s
 and atria (0.3m/s) Delay in the AVN – of 0.09 s. Due to reduced gap junction number. Allows time for the ventricles to fill completely before they contract. Rapid transmission through Purkinje fibres (4m/s) due to many gap junctions. Transmission in ventricular muscle- 0.3 – 0.5m/s.")
11
AP in a ventricular muscle fibre
1 2 3 4 Phase 0 : rapid depolarization – opening of fast Na channels Phase 1 : rapid repolarisation – closure of Na channels Phase 2 : Plateau – slow prolonged opening of Ca channels Phase 3 : final repolarisation – closure of Ca channels Phase 4 : RMP (-85 to -90 mv) – opening of K channels
 – opening of K channels.")
12
REFRACTORY PERIOD : Refractory to re-stimulation during Action potential Absolute refractory period = 0.25 – 0.3 s. Phase 0 to 2 and half of phase 3 Relative refractory period = phase 4 Refractory period of the atria is shorter than that of ventricle

13
Variation in length of action potential and associated phenomena with cardiac rate.1
Heart Rate 75/min Heart Rate 200/min Duration, each cardiac cycle 0.80 0.30 Duration of systole 0.27 0.16 Duration of action potential 0.25 0.15 Duration of absolute refractory period 0.20 0.13 Duration of relative 0.05 0.02 Duration of diastole 0.53 0.14 1 All values are in seconds.

14
Effect of autonomic nervous system on conduction

15
Effect of parasympathetic system
Vagal stimulation causes release of Ach Two effects: ↓ rate of rhythm of SAN – RMP becomes more negative ↓ excitability of A-V junctional fibres Slowing of heart rate, complete block in transmission may occur Strong vagal stimulus → ventricles stop beating for 5-20s → purkinje fibres take over → ventricles contract at beats per minute → VENTRICULAR ESCAPE

16
Effect of sympathetic system
Sympathetic stimulation → Noradrenaline released Three effects : ↑ rate of SAN discharge – RMP more positive ↑ rate of conduction and overall excitability ↑ the force of contraction – increases Ca permeability Heart rate may increase 3 times and strength of contraction may increase 2 times the normal

17
EXCITATION-CONTRACTION COUPLING
Mechanism by which AP causes myofibrils to contract AP over cardiac muscle membrane Reaches interior through T Tubules T tubule AP acts on longitudinal sarcoplasmic reticulum Release of Ca ions into sarcoplasm Ca ions catalyze sliding of actin-myosin filaments

18
How is this different from the skeletal muscle contraction?
T tubules also pump Ca ions into the sarcoplasm Ca from sarcoplasmic reticulum + T tubules = effective contraction Sarcoplasmic reticulum in cardiac muscle – less well developed T tubule diameter and volume in cardiac muscle >> skeletal muscle Since T tubules are in contact with ECF in the interstitium, the ECF Ca concentration determines the strength of the contraction

19
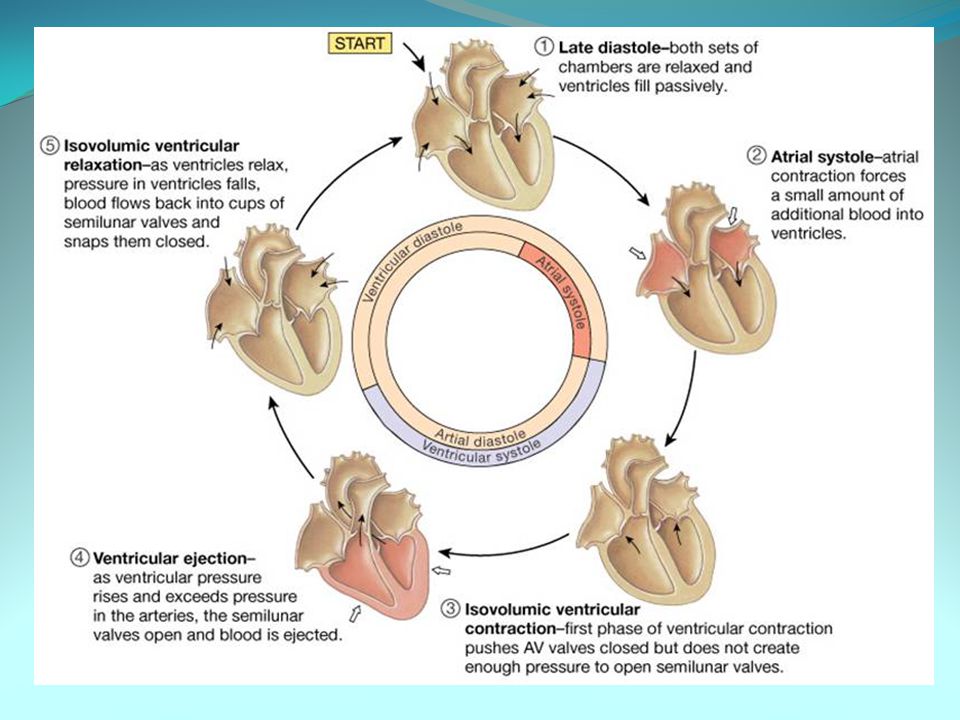
MECHANICAL EVENTS The heart contracts and relaxes alternately during every heart beat and this occurs in concordance with the electrical events. The mechanical events can be studied in various phases such as:

22
ATRIAL SYSTOLE ATRIA = PRIMER PUMPS . Atrial contraction
Atrial Depolarization Atrial contraction Atrial pressures rise Blood flows across AV valves Ventricular filling : 80% - direct flow from SVC 20% - atrial contraction. ATRIA = PRIMER PUMPS .

24
…….. Atrial systole JVP – ‘a’ wave ECG – P wave preceeds the atrial systole. PR segment – depolarization proceeds to the AVN. The brief pause allows complete ventricular filling Heart sounds - S 4 – pathological. Vibration of the ventricular wall during atrial contraction. Heard in ‘stiff’ ventricle like in hypertrophy and in elderly. Also heard in massive pulmonary embolism, cor pulmonale, TR

25
ISOVOLUMETRIC CONTRACTION
Increase in ventricular pressure > atrial pressure → AV valves close After 0.02s, semilunar valves open Period between AV valve closure and semilunar valve opening → contraction occurs without emptying Tension develops without change in muscle length

27
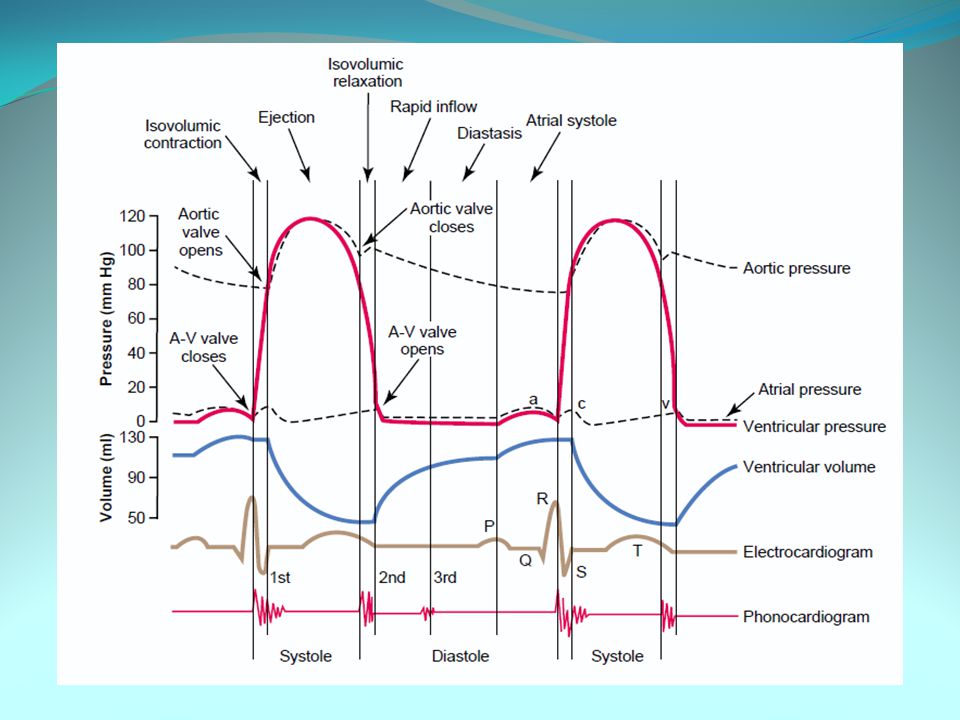
ECG – Interval between QRS complex and T wave (QT interval)
………… Isovolumetric contraction JVP – ‘c’ wave → due to the bulging of the Tricuspid valve into RA secondary to increased pressure in the ventricle. ‘x’ descent ECG – Interval between QRS complex and T wave (QT interval) Heart Sounds – S1 : closure of the AV valves. Normally split as mitral valve closure preceeds tricuspid valve closure.
 Heart Sounds – S1 : closure of the AV valves. Normally split as mitral valve closure preceeds tricuspid valve closure.")
28
EJECTION When LV pres > 80 mm Hg RV pres > 8 mm Hg,
The semilunar valves open. Rapid Ejection – 70% emptying in first 1/3 Slow Ejection – 30% in last 2/3 The pressure in the ventricle keeps decreasing until it becomes lower than that of the great vessels

30
Aortic pressure - Rapid rise in the pressure = 120 mm Hg
…………. ejection JVP – no waves ECG – T wave Heart sounds – none Aortic pressure - Rapid rise in the pressure = 120 mm Hg Even at the end of systole pressure in the aorta is maintained at 90 mm Hg because of the elastic recoil

31
ISOVOULUMETRIC RELAXATION
When ventricle pressure < arterial pressure→ backflow of blood → forces semilunar valves to close. For s, ventricle relaxes despite no change in its volume Meanwhile, atria fill up and atrial pressure gradually rises Pressures in ventricle keep falling till it is < atrial pressure

33
JVP – ‘v’ wave – due to venous return to the atria from SVC and IVC
…………… isovolumetric relaxation JVP – ‘v’ wave – due to venous return to the atria from SVC and IVC ECG- no deflections Heart sounds – S2 : closure of the semilunar valves. Normally split because aortic valve closes slightly earlier than the pulmonary valve Aortic pressure curve – INCISURA - when the aortic valve closes. Caused by a short period of backflow before the valve closes followed by sudden cessation of the backflow when the valve closes.

34
VENTRICULAR FILLING Begins with the opening of AV valves
Rapid filling – first 1/3 of diastole Reduced filling (Diastasis) – middle 1/3 of diastole Atrial contraction – last 1/3 of diastole As the atrial pressures fall, the AV valves close and left ventricular volume is now maximum → EDV (120 ml in LV)
 – middle 1/3 of diastole. Atrial contraction – last 1/3 of diastole. As the atrial pressures fall, the AV valves close and left ventricular volume is now maximum → EDV (120 ml in LV)")
36
JVP – ‘y’ descent ECG – no deflections
…………… ventricular filling JVP – ‘y’ descent ECG – no deflections Heart sounds - S3 - Pathological in adults. Seen in dilated congestive heart failure, MI, MR, severe hypertension. Normal in children.

37
VARIOUS PRESSURE VALUES
CHAMBERS NORMAL RANGE (mm of Hg) Right Atrium 2 – 6 Right Ventricle ( systolic) (diastolic) 15 – 25 2 -8 Pulmonary Artery (systolic) 8 - 15 Left Atrium 6 - 12 Left Ventricle (systolic) 100 – 140 3 – 12
 Right Atrium. 2 – 6. Right Ventricle ( systolic) (diastolic) 15 – Pulmonary Artery (systolic) Left Atrium Left Ventricle (systolic) 100 – – 12.")
38
VENTRICULAR PRESSURE- VOLUME LOOP
a – Ventricular filling – Mitral valve closes b – isovol contraction – Aortic valve opens c – ejection – Aortic valve closes d – isovol relaxation – Mitral valve opens

39
The filling phase moves along the end-diastolic pressure-volume relationship (EDPVR)
The slope of the EDPVR is the reciprocal of Ventricular Compliance The maximal pressure that can be developed by the ventricle at any given left ventricular volume → end-systolic pressure-volume relationship (ESPVR), which represents the inotropic state.
, which represents the inotropic state.")
40
SYSTOLIC DYSFUNCTION Impaired ventricular contraction
↓ slope of ESPVR i.e. ↑ ESV Compensatory rise in preload i.e. ↑ EDV ↓ SV ↓ EF ↓ Work ↑ EDP

41
FORCE- VELOCITY RELATIONSHIP
At any given preload and afterload, a loss of inotropy results in decrease in shortening velocity of the cardiac fibres.

42
DIASTOLIC DYSFUNCTION
Reduced venous return / compliance / relaxation (lusitropy) ↓ EDV ↓ SV ↓ or = EF ↓ Work ↑ EDP
 ↓ EDV. ↓ SV. ↓ or = EF. ↓ Work. ↑ EDP.")
43
MITRAL STENOSIS Impaired LV filling ↓ EDV ↓ afterload ; ↓ ESV
↓ SV and CO

44
MITRAL REGURGITATION Afterload on LV ↓ Outflow resistance is ↓
EDV and EDP ↑ ↑ SV ↓ EF

45
AORTIC STENOSIS High outflow resistance; LV emptying impaired
↑ Peak systolic pressure; ↑ afterload ↓ SV ↑ ESV ↑ EDV

46
AORTIC REGURGITATION No true isovolumetric relaxation
Blood from aorta to ventricle throughout diastole ↑ EDV ↑ SV (if no failure) ↑ ESV and ↓ SV in failure
 ↑ ESV and ↓ SV in failure.")
47
SUMMARY The conduction system and the atrial and ventricular muscle in the normal heart work in an extremely well co- ordinated manner to ensure correct opening and closure of the atrio- ventricular and semilunar valves and movement of the blood through the heart in an appropriate direction with minimal regurgitation.

48
REFERENCES 1 . William F. Ganong. The heart as a Pump. Review of Medical Physiology, Lange, 2010: Guyton and Hall. Heart Muscle, the heart as a Pump and function of the heart valves. Textbook of Medical Physiology.Philadelphia, Mosby Elsevier, 2006: Ronald D. Miller. Cardiac Physiology.Miller’s Anaesthesia.Philadelphia, Mosby Elsevier, 2010:

49
THANK YOU

Similar presentations


>")


 –Contracts.>")

