Download presentation
Presentation is loading. Please wait.

1
Welfare Programs Lecture 17 Today’s readings: Schiller Ch 12, Welfare Programs Ehrenberg and Smith, “ Supply of Labor to the Economy, ” eReserves House Ways and Means Committee 2004 Green Book, http://www.gpoaccess.gov/wmprints/green/2004.html http://www.gpoaccess.gov/wmprints/green/2004.html DeParle, Ch. 14: Golf Balls and Corporate Dreams: Milwaukee, 1997-1999

2
Today’s Questions What means-tested welfare programs are available for poor people in the United States? How much do these programs cost? How many people are helped by these programs? How are welfare benefits determined? Why is welfare so hard to reform?

3
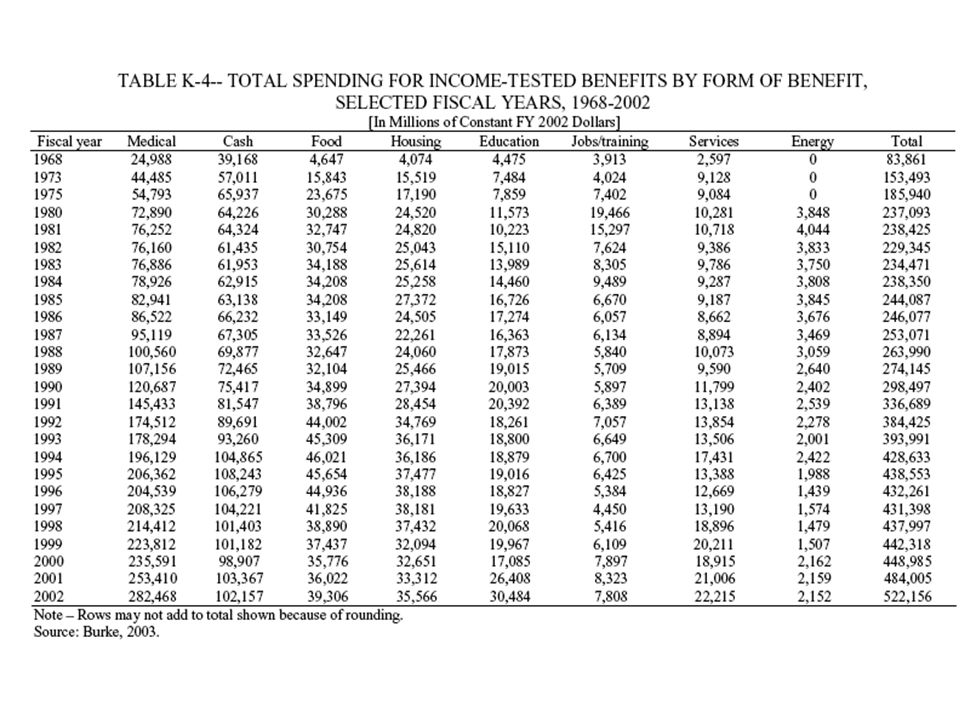
What means-tested welfare programs are available for poor people in the U.S.? Federal and State governments funded 85 welfare programs in FY 2002 at a total cost of $522 billion. –Federal Share: 71% –State and Local Share: 29% The means-tested programs fall into 8 different categories. –Source for Slides 3-24: House Ways and Means Committee 2004 Green Book, http://www.gpoaccess.gov/wmprints/green/2004.htmlhttp://www.gpoaccess.gov/wmprints/green/2004.html

4
Eight Categories of Welfare Programs and Total Costs, 2002 –Medical Aid: $282 billion, 54% –Cash Aid: $102 billion, 20% –Food Aid: $39 billion, 7% –Housing Aid: $36 billion, 7% –Education Aid: $30 billion, 6% –Other Services: $22 billion, 5% –Jobs and Training Aid: $8 billion, 2% – Energy Aid: $2 billion, 0.3%

5
Medical Aid--$282 billion

6
Cash Aid--$102 billion

7
Food Aid--$39 billion

8
Housing Aid--$36 billion

9
Housing Aid, cont.

10
Education Aid--$30 billion

11
Other Services--$22 billion

12
Jobs and Training Aid--$8 billion

13
Energy Aid--$2 billion

14
Analysis of spending 54 cents of every welfare dollar went for medical assistance 80% of State and Local dollars went to medical aid Spending in each of 6 programs exceeds $10 billion and accounts for 77 percent of total spending.

15
7 largest programs by amount spent Medicaid ($258 billion) SSI ($39 billion) EITC ($28 billion) Food Stamps ($24 billion) TANF cash,,services, child care, and work activities ($24 billion) Section 8 low-income housing assistance ($18 billion) Pell Grants ($11)
 SSI ($39 billion) EITC ($28 billion) Food Stamps ($24 billion) TANF cash,,services, child care, and work activities ($24 billion) Section 8 low-income housing assistance ($18 billion) Pell Grants ($11)")
16
Trends in Spending Real spending for cash and non-cash programs increased by 523 percent from FY1968 to FY2002. Real spending for cash and non-cash programs increase 36 percent between FY1992 and FY2002. Average annual rate of growth over this 32 year period was 5.5 percent. The U.S. population increased by 43 percent over this period. Real total per capita spending grew from $416 in FY1968 to $1,826 in FY 2002.

18
Spending Trends by Type of Aid FY1968-FY2002 (Constant FY 2002 Dollars) Medical+Cash+Food+Housing Aid=.88 x Total Spending
 Medical+Cash+Food+Housing Aid=.88 x Total Spending")
19
Trends in Spending by Level of Government, FY1968-FY2002 (Constant FY 2002 Dollars)
")
20
Trends in Federal Spending FY1968-FY2002 (Constant FY 2002 Dollars) Real Federal spending climbed from $60 billion in FY1968 to $373 billion in FY 2002, an increase of 529 percent. Cash aid was the leading form of Federal welfare until 1980 when medical aid overtook it.

21
Trends in State and Local Spending FY1968-FY2002 (Constant FY 2002 Dollars) State and Local real spending climbed from $24.5 billion in FY1968 to $149 billion in FY2002, an increase of 508 percent. Medical assistance overcame cash aid as the leading form of income-tested assistance in1976.

23
Share of Federal Budget used for Income-Tested Aid, FY1968-2002

24
Participation in Means-tested Programs, 2002 We do not have an unduplicated count of welfare beneficiaries Average 2002 monthly numbers: –Medicaid: 50.9 million persons –Food stamps: 20.2 million recipients –SSI: 6.9 million recipients –TANF: 5.1million recipients EITC: 16.8 million tax filers

25
Source: CBO Economic and Budget Issue Brief, “Changes in Participation in Means-Tested Programs” http://www.cbo.gov/ftpdocs/63xx/doc6302/04-20-Means-Tested.pdf http://www.cbo.gov/ftpdocs/63xx/doc6302/04-20-Means-Tested.pdf

26
Predicting Future Participation Assuming no legislative changes, future levels of participation in means-tested welfare programs will depend on: –Demographic trends –Distribution of income –The state of the economy

27
Participation in Means-tested Programs by Poor Persons, 2002 Census Bureau found 23 million poor persons (two out of every three with pre-tax money income below the poverty threshold) lived in a household that received means-tested assistance. Percent of the poverty population living in a household that received: –Medicaid: 53 percent –Food Stamps: 33 percent –cash assistance: 22 percent –Subsidized or public housing: 18 percent

28
Participation by Total Population, 2002 Percent of the total population living in a household that received: –Medicaid: 19 percent –Food Stamps: 6 percent –cash assistance: 7 percent –Subsidized or public housing: 4 percent –Some form of major means-tested aid: 25 percent

29
Eligibility vs. Participation To be eligible, a person, family or household must satisfy conditions regarding –Citizenship –Demographic characteristics (children present?) –Countable income –Accumulated wealth (assets including cars, homes, insurance policies, bank accounts) –Employment status
 –Countable income –Accumulated wealth (assets including cars, homes, insurance policies, bank accounts) –Employment status.")
30
Eligibility vs. Participation Participation refers to actual receipt of cash, non-cash benefits, or services. Not all eligible persons participate. –Participation rates = participating population/eligible population Participation levels/rates depend upon: –Demographic trends, labor market conditions, distribution of income, health care costs, and the level of benefits.

31
Eligibility vs. Participation, cont An individual’s decision depends on the net benefits of participation: Net benefits=Gross Benefits-Costs Gross Benefits include: –Primary benefits (cash, non-cash, services) –Secondary benefits (eligibility for subsequent programs depends on enrollment in the primary program Costs include: –Hassle –Transportation –documentation –Stigma
 –Secondary benefits (eligibility for subsequent programs depends on enrollment in the primary program Costs include: –Hassle –Transportation –documentation –Stigma.")
32
How are benefits determined? Generic formula: B=G - t(E-D E ) - (U-D U ), where B=Benefit level G=Maximum benefit (other income=0) T=marginal tax rate E=gross earnings D E =earnings disregard U=non-earnings incomes (pensions, interest) D U =non-earnings disregard
 - (U-D U ), where B=Benefit level G=Maximum benefit (other income=0) T=marginal tax rate E=gross earnings D E =earnings disregard U=non-earnings incomes (pensions, interest) D U =non-earnings disregard.")
34
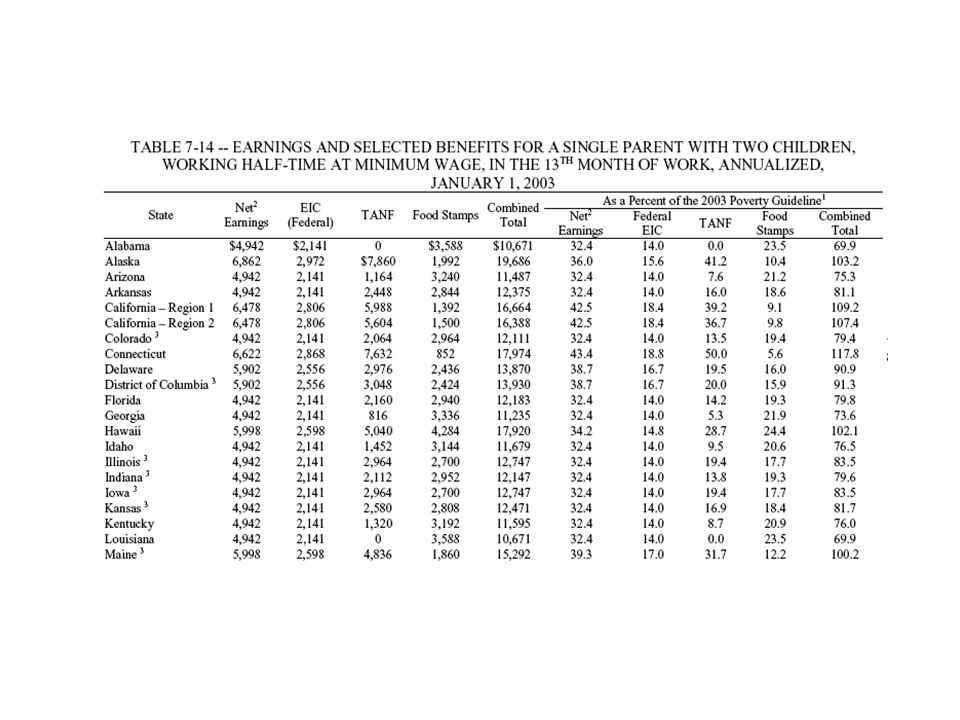
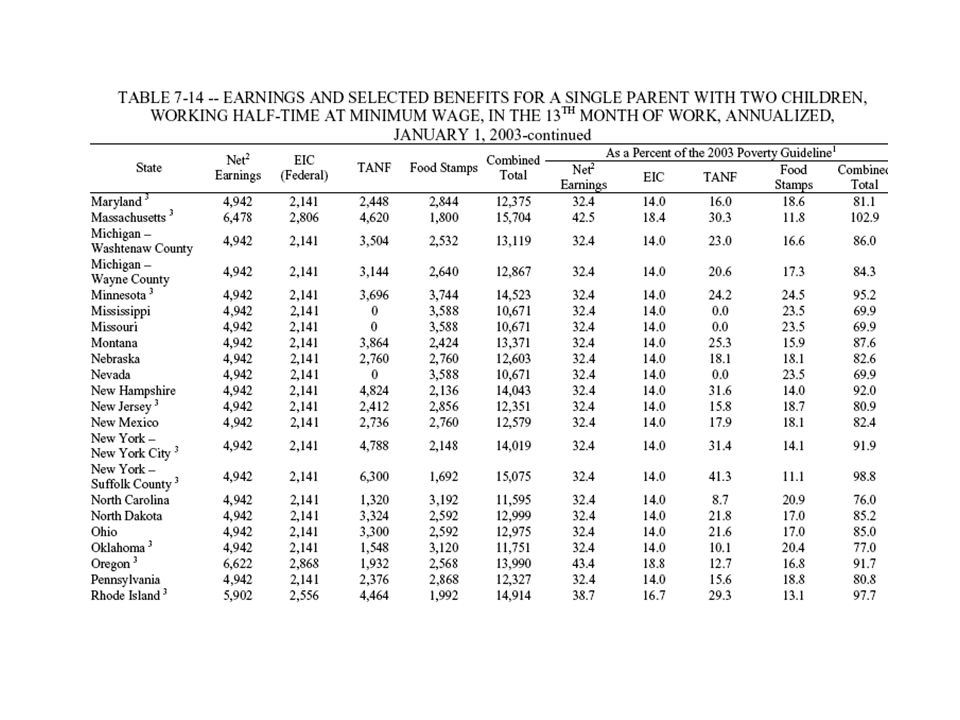
Source: House Ways and Means Committee 2004 Green Book, pp. 38-39 http://www.gpoaccess.gov/wmprints/green/2004.html http://www.gpoaccess.gov/wmprints/green/2004.html

35
How are benefits determined?, cont. Note that in the preceding table grants vary with family size up to 6 persons. Example using Texas: Assume a mother of two works 30 hours a week for 4.2 weeks at the minimum wage $5.15 per hour. She has no other income. B=$201-.67($649-30)=$201 - 415=-$214 Source: Work Related Provisions of State TANF Plans http://www.acf.dhhs.gov/programs/ofa/WRKREL.HTM http://www.acf.dhhs.gov/programs/ofa/WRKREL.HTM
=$ =-$214 Source: Work Related Provisions of State TANF Plans")
36
Benefit Calculation, cont. In the previous example, the mother would not receive a benefit. Negative benefits are raised to $0. At the level of work hours (30) required by Federal law for a TANF mother to qualify as a work recipient, our Texas mother is not eligible for benefits. At what level of earnings could she receive benefits?
 required by Federal law for a TANF mother to qualify as a work recipient, our Texas mother is not eligible for benefits. At what level of earnings could she receive benefits .")
37
Calculating Break-even Level of Earnings Recall that B=G - t(E-D E ) - (U-D U ). Set B=0, and solve for E: Generally, E B =G/t + D, when U=0. In our example, the Texas mother would be eligible for cash benefits if her earnings were less than $330. –E B =201/.67+30 –E B =$330 She loses eligibility if she works more than 15.25 hours per week.

40
Source: House Ways and Means Committee 2004 Green Book, pp.36-37, http://www.gpoaccess.gov/wmprints/green/2004.html http://www.gpoaccess.gov/wmprints/green/2004.html

41
Source: CBO Economic and Budget Issue Brief, “Changes in Participation in Means-Tested Programs” http://www.cbo.gov/ftpdocs/63xx/doc6302/04-20-Means-Tested.pdf http://www.cbo.gov/ftpdocs/63xx/doc6302/04-20-Means-Tested.pdf

44
Source: House Ways and Means Committee 2004 Green Book, pp.45-47, http://www.gpoaccess.gov/wmprints/green/2004.html http://www.gpoaccess.gov/wmprints/green/2004.html

45
Source: House Ways and Means Committee 2004 Green Book, p. 89 http://www.gpoaccess.gov/wmprints/green/2004.html http://www.gpoaccess.gov/wmprints/green/2004.html

46
Why is welfare so hard to reform? We can gain insight into the difficulty of reforming welfare by considering the implications of the break-even earnings formula: E B =G/t + D

47
Why is welfare so hard to reform?, cont. Traditionally, policy makers heed three goals: –Adequacy –Cost minimization –Encouraging independence through work

48
Why is welfare so hard to reform?, cont. Policy makers have three parameters they can alter to achieve these goals: –G, maximum guarantee –t, marginal tax rate –D, the earnings disregard Given the relationship of G, t, and D, at most two of the three goals can be achieved at any one time.

49
Why is welfare so hard to reform?, cont. GtD Adequacy Cost Minimization Work incentives

50
Why is welfare so hard to reform?, cont. Welfare is so difficult to reform, that is it is difficult to find a long-lasting policy equilibrium, because our political parties differ in the emphasis they give the three goals. Traditionally, –Republicans pursed cost minimization and promoting work above adequacy, while Democrats championed adequacy.

Similar presentations


 Lecture 20. Reading Assignment and Sources Reading Assignment: –Greenstein, “ The Earned Income Tax Credit: Boosting Employment,>")
 VITA Presentation Nicole Simpson January 2013.>")


. Reading Assignment Greenstein, “ The Earned Income Tax Credit: Boosting Employment, Aiding the Working Poor, ”>")


