Download presentation
Presentation is loading. Please wait.

1
The Interviewer Fallacy: Evidence from 10 years of MBA interviews Uri Simonsohn Francesca Gino HBS Photo not necessary

2
Motivation How is a journal editor like a venture capitalist? Continuous flow of judgments “random” “daily” subsets. Research question: Impact of subsetting? Narrow bracketing +Belief in law of small numbers interviewer fallacy Definition. Reluctance to create subsets of judgments that differ too much from expected distribution.

3
Paper in one slide Data: 1-5 Rating of MBA interviewees – Handful per day. corr[avg(so far), this interview]<0 Ruled out alternatives: – Contrast effects – Non-random sequence
, this interview]<0 Ruled out alternatives: – Contrast effects – Non-random sequence.")
4
Data Description A business school gave us data 10 years: N=9,323, k=31 ***INTERRUPT THIS TALK TO COMMENT ON ANOTHER PROJECT*** False-Positive ( PsychScience2011 ) : “list all your variables” Naysayers : “love to, have too many” Authors of False-Positive : “really?” Uri: “ watch me. ”

5
Note: another 22 variables are listed in this page

6
Other side of that single sheet of paper

7
Note: The.pdf weighs 13Kb. The Wharton logo from slide 1: 11kb A hardliner may say: Only reason to choose not to post is to hide information from readers.

8
Back to this talk Data Description A business school gave us data 10 years: N=9,323, k=31* – Interviews per day M=4.5, SD=1.9 – Cluster SE [repeated measures] Info on: – Applicant (e.g, GMAT scores, experience, race, gender) – Interviewer identity – Interview: time, date – Ratings (1-5 likert) 5 subscores: communication, leader, etc. Overall score (M=2.9, SD=0.9)
![Back to this talk Data Description A business school gave us data 10 years: N=9,323, k=31* – Interviews per day M=4.5, SD=1.9 – Cluster SE [repeated measures] Info on: – Applicant (e.g, GMAT scores, experience, race, gender) – Interviewer identity – Interview: time, date – Ratings (1-5 likert) 5 subscores: communication, leader, etc.](http://images.slideplayer.com/13/3975670/slides/slide_8.jpg "Overall score (M=2.9, SD=0.9).")
9
Would like to analyze like gambler fallacy – HHHH pr(T)↑ Problem – Non-binary data – Covariates – Different interviewers
↑ Problem – Non-binary data – Covariates – Different interviewers")
10
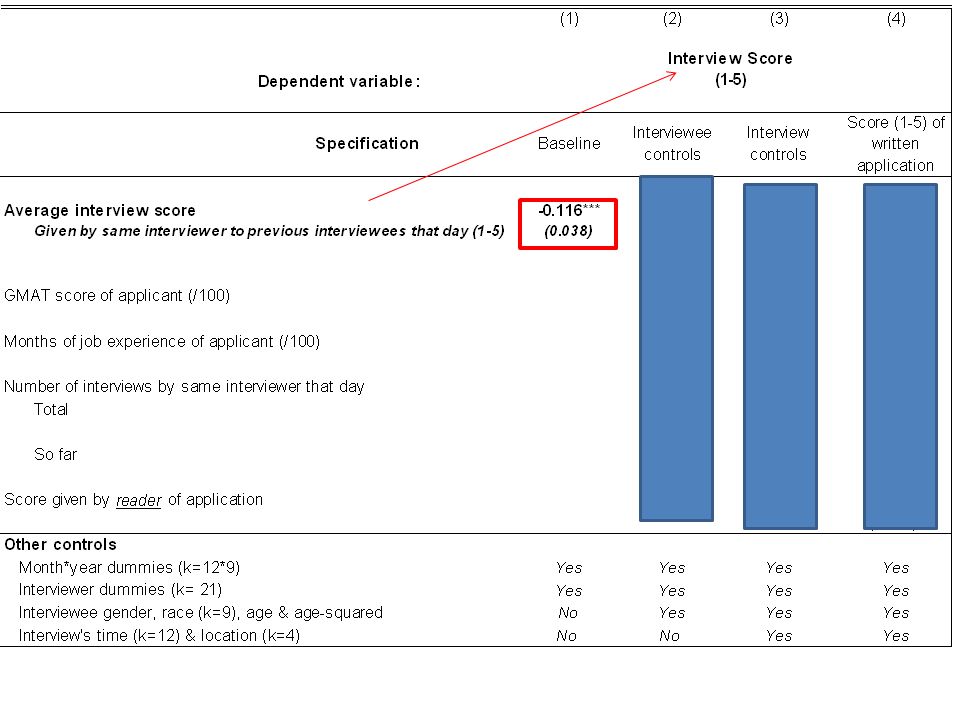
Instead: Score k,i = OLS(average score so far i, covariates) k: Interviewee, 1 to N that day. i : Interviewer Prediction: <0

12
Effect Size Average interview 1 point higher, Equivalent to losing: – 40 GMAT points, or – 30 months of experience.

13
Alternative Explanations Contrast effects Non-random sequencing of interviews

14
Contrast vs. Interviewer Fallacy Two divergent predictions: 1)Same effect on the interview subscores? Explanation Prediction Contrast: yes, and stronger Int.Fallacy: no, or at least weaker. Data: -Every one of five subscores: n.s. -Average a-la Robyn Dawes: n.s. -Biggest point estimate, ¼ as big -one is >0
Same effect on the interview subscores. Explanation Prediction Contrast: yes, and stronger Int.Fallacy: no, or at least weaker. Data: -Every one of five subscores: n.s. -Average a-la Robyn Dawes: n.s. -Biggest point estimate, ¼ as big -one is >0.")
15
Contrast vs. Interviewer Fallacy Two divergent predictions: 2) Effect as end of day approaches. Explanation Prediction Contrast: weaker (arguably) Int.Fallacy: stronger (absolutely) Data: Estimate same regressions for: last interview of day 1 interview left 2 interviews left
 Int.Fallacy: stronger (absolutely) Data: Estimate same regressions for: last interview of day 1 interview left 2 interviews left.")
16
Effect of previous interviews as day’s end approaches

17
Alternative Explanations Contrast effects Non-random sequencing of interviews

18
If better candidates follow bad ones or vice-versa spurious finding. Can we predict objective quality with average-interview-score-so-far? Test: GMAT=OLS(avg.score) Job Experience = OLS(avg.score)
 Job Experience = OLS(avg.score).")
19
Same table + 2 new columns

20
Possible Mechanisms 1)Gambler fallacy + confirmation bias 2)Mental Accounting 3)Accountability
Gambler fallacy + confirmation bias 2)Mental Accounting 3)Accountability")
21
A note on the internal validity of non-lab data In the lab: hard to study interviewer fallacy Participants could be learning about – Scale use – Distribution of underlying stimuli quality Some psychological questions are better studied outside the lab. This seems likes one of them.

Similar presentations


 Distribution for the Sample Mean*>")
. Effects of integrated instruction on motivation and.>")


 and response variable (y). u We.>")


 Therapy effectiveness Integrity tests Research Question What’s the average?>")