Download presentation
Presentation is loading. Please wait.

1
Accounting for Wealth in the Measurement of Household Income Edward N. Wolff New York University, NBER, and Levy Economics Institute Ajit Zacharias The Levy Economics Institute For Presentation at the 2008 World Congress on National Accounts and Economic Performance for Nations

2
Summary of Findings 1. We analyze well-being in the US from 1983 to 2001 using the standard measure, gross money income, and one in which income from wealth is calculated as the sum of lifetime annuity from nonhome wealth and imputed rental-equivalent for owner-occupied homes. 2. Over this period, median well-being increases faster when these adjustments are made than when money income is used. 3. This adjustment also widens the income gap between African-Americans and whites but increases the relative well-being of the elderly.

3
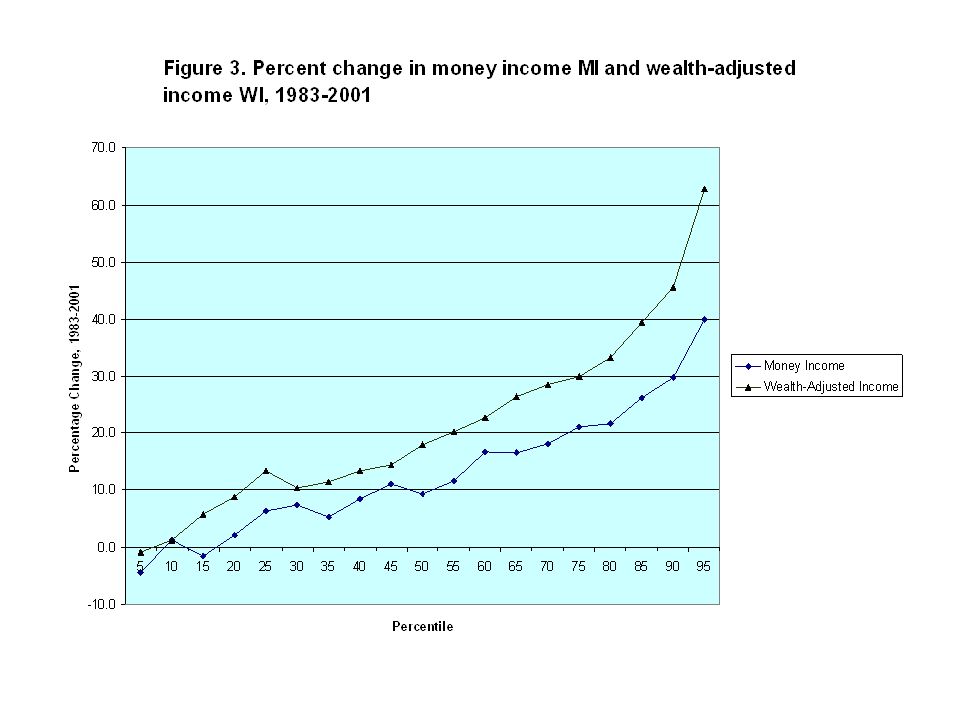
Summary (continued) 4. Adding imputed rent and annuities from household wealth to household income considerably increases measured inequality and the share of income from wealth in inequality. 5. However, both measures show about the same rise in inequality over the period. 6. Our results also give little support to the assertion that the “working rich” has replaced rentiers at the top of the economic ladder.

4
Outline of paper 1. Summarize previous attempts to incorporate wealth into a measure of well-being. 2. Describe the main sources of data and concepts of wealth used in the study. 3. Discuss how we incorporate wealth into a combined income-net worth measure. 4. Show results for all households and sub-groups.

5
Outline (continued) 5. Compare our estimates of top income shares and those of Piketty and Saez (2003) to assess whether rentiers were at the top of the economic ladder during this period. 6. Make concluding remarks.
 to assess whether rentiers were at the top of the economic ladder during this period. 6. Make concluding remarks..")
6
A review of previous literature 1. There have been several attempts to combine the income and wealth dimension into a single index of household well-being. The most common technique is to convert the stock of wealth into a flow and add that flow to current income. In this approach, wealth is converted into a lifetime annuity for the expected remaining life of the family. The annuity is defined as a stream of annual payments which are equal over time and which will fully exhaust the stock of initial wealth. This annuity is then added to obtain an augmented measure of family income after property income is first subtracted from current money income so that there is no double counting of the returns from household wealth.

7
Literature review (continued) 2. Weisbrod and Hansen (1968) used the 1962 Survey of the Financial Characteristics of Consumers (SFCC). They found that the share of the top two income classes increased from 5 to 8 percent at a 4 percent annuity rate and to 10 percent at a 10 percent rate, while the share of the bottom income class fell from 20 percent to 18 and then to 17 percent. 2. Taussig (1973) made use of the 1967 Survey of Economic Opportunity (SEO) database. When 1 6% annuity is added to current money income, the measured Gini coefficient for all families rose from 0.36 to 0.39.
 used the 1962 Survey of the Financial Characteristics of Consumers (SFCC). They found that the share of the top two income classes increased from 5 to 8 percent at a 4 percent annuity rate and to 10 percent at a 10 percent rate, while the share of the bottom income class fell from 20 percent to 18 and then to 17 percent. 2. Taussig (1973) made use of the 1967 Survey of Economic Opportunity (SEO) database. When 1 6% annuity is added to current money income, the measured Gini coefficient for all families rose from 0.36 to")
8
Literature Review (continued) 4. Wolfson (1979) used the 1970 Canadian Survey of Consumer Finances. He found that among all households the inclusion of a wealth annuity with money income had no effect on the Gini coefficient, which remained in the range of 0.36 to 0.37. 5. The three studies generally found that the distribution of income becomes more unequal once the returns to wealth are included as part of total income. However, the disequalizing effects are not great because the annuity payments are small relative to current money income, typically on the order of 10 percent on average..

9
SOME MOTIVATION Consider two individuals A and B. A buys a bond at par value and receives only interest income. B buys the bond at a discount with the SAME yield and receives only capital gains. In NIPA only interest included in personal income but A and B are EQUALLY well-off in terms of well- being. (Also compare stocks with same yield but different mix of dividends and capital gains).
..")
10
Data and concepts 1. Our basic data source is the Federal Reserve Board’s Surveys of Consumer Finances (SCF) for 1983, 1989, 1995, and 2001. 2. We impute rent for owner-occupied housing by distributing the total amount of imputed rent in the GDP to homeowners in the SCF, based on the values of their house. On average, imputed rent was 5.6 percent and 5.4 percent (respectively) of the total value of houses in 1989 and in 2001.
 for 1983, 1989, 1995, and We impute rent for owner-occupied housing by distributing the total amount of imputed rent in the GDP to homeowners in the SCF, based on the values of their house. On average, imputed rent was 5.6 percent and 5.4 percent (respectively) of the total value of houses in 1989 and in")
11
Data and Concepts (continued) 3. Another difference in our approach compared to the earlier ones cited above is that we use actual historical rates of return in computing lifetime annuities. Moreover, we take into account the differences in the portfolio composition of non-home wealth by computing the lifetime annuity as the weighted average of annuity flows generated by individual non-home wealth components with portfolio shares of these six components as weights. The lifetime annuity amount calculated is such that (i) it is the same for all remaining years of the younger spouse’s life. and (ii) it brings wealth down to zero at the end of the expected lifetime.
 it is the same for all remaining years of the younger spouse’s life. and (ii) it brings wealth down to zero at the end of the expected lifetime..")
12
Data and Concepts (continued) 4. The total real rate of return of each non-home wealth component is the average of annual rates over a relatively long period of time, varying from 14 to 40 years, depending on the asset. The rationale for employing this method, instead of using the rate of return in an arbitrarily chosen year, is that the annuity value estimated this way is a better indicator of the resources available to the household on a sustainable basis over its lifetime. The total rates of return data we use are inclusive of both the capital gains and the income generated by the assets. In order to avoid double counting, we net out from the total income measure any property income already included in money income.

13
Table 1. Family Income by Alternative Definitions (2001$)
")
Similar presentations


 2000 by Harcourt, Inc. All rights reserved. Chapter 7 Valuation Concepts Bond Values Stock Values Rates of Return Market Equilibrium.>")


