Download presentation
Presentation is loading. Please wait.

1
MOFEP Ground Flora Study: Effects of Forest Management Practices on Woodland Plant Communities Susan Farrington Plant Community Ecologist Missouri Department of Conservation Forest Systems Field Station West Plains, MO

2
Between 70 and 76 vegetation plots are located on each site (compartment) Total: 648 plots SAMPLING DESIGN AND PROTOCOL:
 Total: 648 plots SAMPLING DESIGN AND PROTOCOL:")
3
Each stand contains at least one vegetation plot

4
Plots are distributed proportionately across Ecological Landtypes

5
Dry chert woodland Dry-mesic chert woodland Dry-mesic dolomite forest Dolomite glade 7.3 Dry- mesic bottomland forest 25 Dry igneous woodland Ecological landtypes and natural communities on MOFEP Dry-mesic chert forest Site 1 No harvest Site 2 Uneven-aged Site 3 Even-aged Site 4 Uneven- aged Site5 Even-aged Site 9 Even-aged Site 6 No harvest Site 8 No harvest Site 7 Uneven-aged 1.1 1.2 1.3 2.1 3.1 2.2 2.3 3.2 4.1 5.2 4.2 9.2 11 6.2 10.1 12 13 7.1 Dry dolomite woodland 8.1

6
½ acre circular plots 4 subplots 1/20 acre 4 1m 2 quadrats per subplot Total of 16 1m 2 quadrats per plot MOFEP Vegetation Plots

7
At each quadrat: All herbaceous plants and woody seedlings with foliage less than 1 m are identified and percent cover below 1 m is estimated to nearest 1%. % cover for each category of ground cover (litter, down dead wood, bare, etc) is estimated. Canopy closure is estimated at the bottom left corner of each quadrat.
 is estimated. Canopy closure is estimated at the bottom left corner of each quadrat..")
8
YearGround flora data collected 1993Full sample 1994Full sample 1995Full sample 1996HARVEST 1997Incomplete sample – different protocol 1998 1999Full sample (original protocol) 2000Full sample 2001Full sample 2002Subsample 2003 2004 2005 2006 2007Subsample (same plots as 2002) Plans for next harvest cycle: Full sample 2009 and 2010 Harvest 2011 Full sample 2012 and 2013 Full sample 2016 and 2017
 2000Full sample 2001Full sample 2002Subsample Subsample (same plots as 2002) Plans for next harvest cycle: Full sample 2009 and 2010 Harvest 2011 Full sample 2012 and 2013 Full sample 2016 and 2017")
9
Mean species richness per plot before first harvest (1993-95) No harvest sites Uneven-aged sites Even-aged sites Site 1Site 6Site 8Site 2Site 4Site 7Site 3Site 5Site 9
 No harvest sites Uneven-aged sites Even-aged sites Site 1Site 6Site 8Site 2Site 4Site 7Site 3Site 5Site 9")
10
No harvest management Uneven-aged management Even-aged management MOFEP Site Locations and Treatments 6 1 2 5 3 7 8 9 4

11
1620-1700 Depopulated era 1781-1820 Cherokee, Delaware, Shawnee 1701-1780 Quapaw and Osage 8 7 9 1 2 3 4 5 6 8 7 9 1 2 3 4 5 6 8 7 9 1 2 3 45 6 Guyette et al. 2003

12
Data from 1993-2007: 482,755 records!

13
Woodland Glade Forest ExoticGeneralist Woody Ruderal Native disturbance species Common plants found in multiple communities Woody vines

14
Ground Flora Study Questions: 1.How is the composition of natural communities affected by management practices? 2.How are species richness, diversity and dominance affected by management practices? 3.What management practices benefit the maximum number of conservative species in each natural community type? 4.How much of a canopy opening do fire-dependent woodland species require to flower and reproduce? How long can such species persist vegetatively after canopy closure? 5.What happens over time? Does a treated plot resemble an untreated plot after a certain period of time? Are treatment effects short-lived or long lasting?

15
Clearcut Woodland Site 3 Plot 70 October 2008

16
Block 1 Mean Species Richness per plot Harvest

17
Block 2 Mean Species Richness per plot Harvest

18
Block 3 Mean Species Richness per plot Harvest

19
Mean Species Richness of woodland plots by prescription Pre-trmt Post-trmt Pre-trmt

20
Rattlesnake master 8 Glade coneflower 7 Poison ivy 2 Daisy fleabane 1 Poison ivy 2 Coefficients of Conservatism (Ladd 1991)
")
21
Mean Conservatism of woodland plots by prescription Pre-trmt Post-trmt Pre-trmt

22
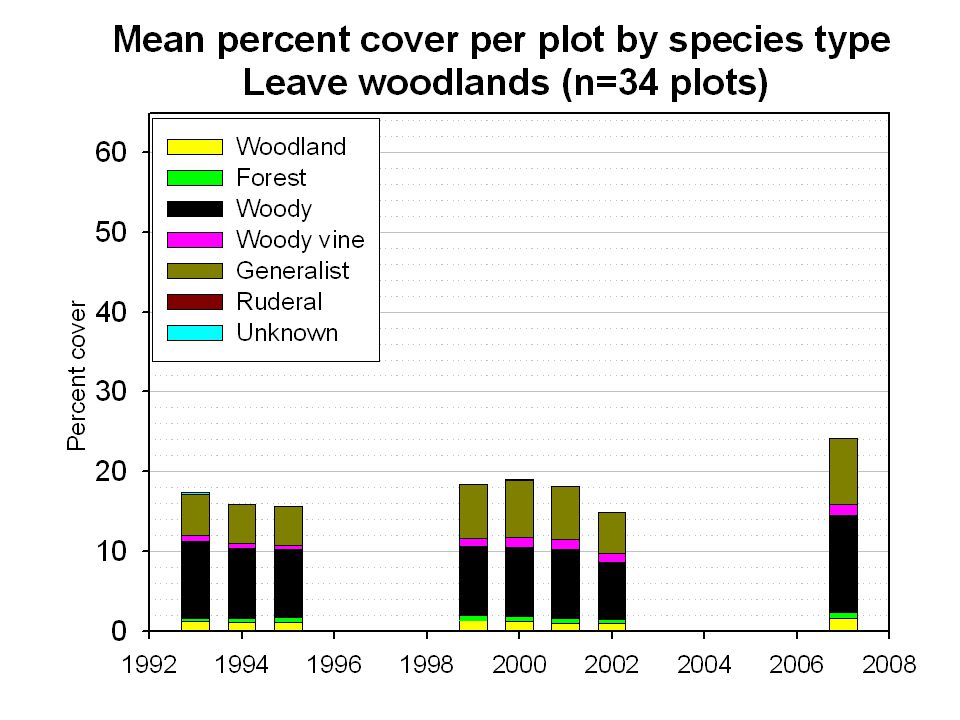
Woodland Clearcut plots (n=25 plots) Pre-trmt Post-trmt Pre-trmt
 Pre-trmt Post-trmt Pre-trmt")
23
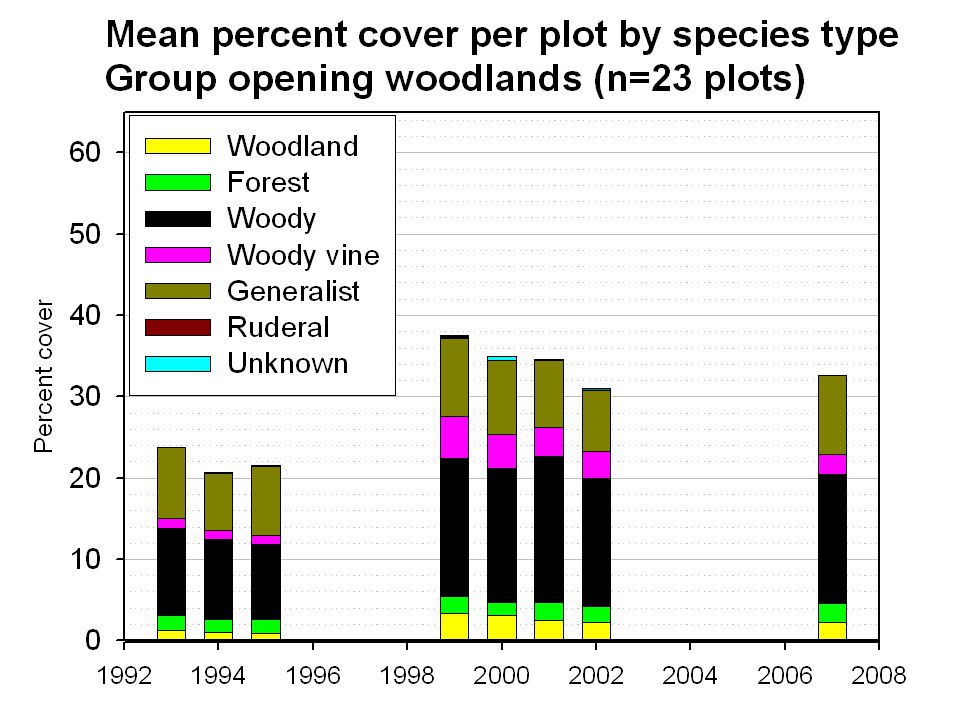
Intermediate thin plots (n=25 plots) Pre-trmt Post-trmt
 Pre-trmt Post-trmt")
24
Mean Species Richness of woodland plots by prescription – subsample Post-trmt Pre-trmt

25
Mean Conservatism of woodland plots by prescription – subsample Pre-trmt Post-trmt

35
Clearcut Woodland Site 3 Plot 70 October 2008

37
Thanks to many people: Jenny Grabner for overseeing the collection of most of these data, and for sharing her insights Mike Wallendorf and Steve Sheriff for statistical expertise Randy Jensen for all his MOFEP experience and knowledge Julie Fleming and Carrie Steen for helping me deal with a monstrous database Aaron Stevenson for serving as a good sounding board Tim Smith, George Yatskievych and Paul McKenzie for botanical expertise Slews of suffering summer botanists! And especially Dan Drees for sharing his insights and putting up with the long hours I’ve spent on this project

Similar presentations


 by layer and aerial canopy cover of each growth habit Phase 2 Vegetation Profile Summary.>")


 on forest vegetation in eastern North America Jason S. Kilgore,>")


