Download presentation
Presentation is loading. Please wait.

1
U5AUA10 AUTOMOTIVE POLLUTION AND CONTROL V SEM-AUTOMOBILE

2
UNIT I - Pollution Pollution is the introduction of contaminants into the natural environment that cause adverse change Air Pollution Water Pollution Soil pollution

3
Automotive emissions have three sources:
Evaporative Crankcase Exhaust

4
Types of Emission Exhaust Emission Evaporative Emission Pollutants in Exhaust Gas Carbon monoxide(CO) Oxides of Nitrogen(Nox) Hydro Carbons(HC) Smoke and Soot Lead Sulphuric Oxide Particulate
 Hydro Carbons(HC) Smoke and Soot. Lead. Sulphuric Oxide. Particulate.")
5
HC CO Catalytic Converter Exhaust manifold Fuel Tank Air Fuel Pump
Solid particulate Catalytic Converter Exhaust manifold Fuel Tank Air Fuel Pump Fuel Fuel Vapors Fuel

6
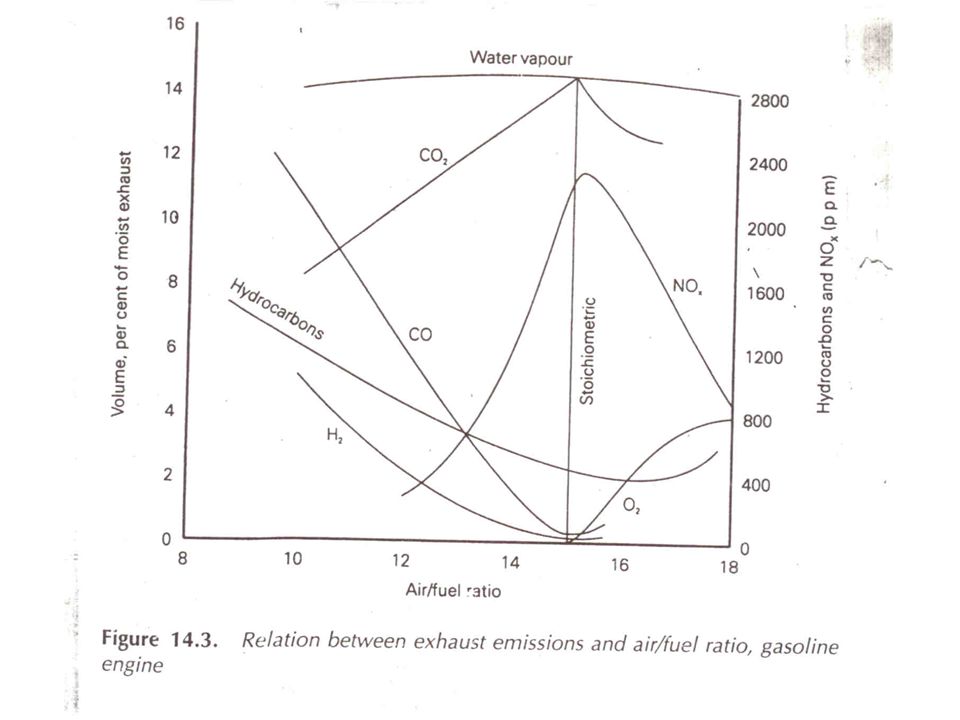
Exhaust Gasses HC increases NOx increases Richer Leaner 14.7 – 1 AFR
Hc and Co decreases NOx decreases

7
Adverse Health Effects of IC Engine Generated Air Pollutants

9
Table 1: Sources, Health and Welfare Effects for Criteria Pollutants.
Description Sources Health Effects Welfare Effects Carbon Monoxide (CO) Colorless, odorless gas Motor vehicle exhaust, indoor sources include kerosene or wood burning stoves. Headaches, reduced mental alertness, heart attack, cardiovascular diseases, impaired fetal development, death. Contribute to the formation of smog. Sulfur Dioxide (SO2) Colorless gas that dissolves in water vapor to form acid, and interact with other gases and particles in the air. Coal-fired power plants, petroleum refineries, manufacture of sulfuric acid and smelting of ores containing sulfur. Eye irritation, wheezing, chest tightness, shortness of breath, lung damage. Contribute to the formation of acid rain, visibility impairment, plant and water damage, aesthetic damage. Nitrogen Dioxide (NO2) Reddish brown, highly reactive gas. Motor vehicles, electric utilities, and other industrial, commercial, and residential sources that burn fuels. Susceptibility to respiratory infections, irritation of the lung and respiratory symptoms (e.g., cough, chest pain, difficulty breathing). Contribute to the formation of smog, acid rain, water quality deterioration, global warming, and visibility impairment. Ozone (O3) Gaseous pollutant when it is formed in the troposphere. Vehicle exhaust and certain other fumes. Formed from other air pollutants in the presence of sunlight. Eye and throat irritation, coughing, respiratory tract problems, asthma, lung damage. Plant and ecosystem damage. Lead (Pb) Metallic element Metal refineries, lead smelters, battery manufacturers, iron and steel producers. Anemia, high blood pressure, brain and kidney damage, neurological disorders, cancer, lowered IQ. Affects animals and plants, affects aquatic ecosystems. Particulate Matter (PM) Very small particles of soot, dust, or other matter, including tiny droplets of liquids. Diesel engines, power plants, industries, windblown dust, wood stoves. Eye irritation, asthma, bronchitis, lung damage, cancer, heavy metal poisoning, cardiovascular effects. Visibility impairment, atmospheric deposition, aesthetic damage.
 Colorless, odorless gas. Motor vehicle exhaust, indoor sources include kerosene or wood burning stoves. Headaches, reduced mental alertness, heart attack, cardiovascular diseases, impaired fetal development, death. Contribute to the formation of smog. Sulfur Dioxide (SO2) Colorless gas that dissolves in water vapor to form acid, and interact with other gases and particles in the air. Coal-fired power plants, petroleum refineries, manufacture of sulfuric acid and smelting of ores containing sulfur. Eye irritation, wheezing, chest tightness, shortness of breath, lung damage. Contribute to the formation of acid rain, visibility impairment, plant and water damage, aesthetic damage. Nitrogen Dioxide (NO2) Reddish brown, highly reactive gas. Motor vehicles, electric utilities, and other industrial, commercial, and residential sources that burn fuels. Susceptibility to respiratory infections, irritation of the lung and respiratory symptoms (e.g., cough, chest pain, difficulty breathing). Contribute to the formation of smog, acid rain, water quality deterioration, global warming, and visibility impairment. Ozone (O3) Gaseous pollutant when it is formed in the troposphere. Vehicle exhaust and certain other fumes. Formed from other air pollutants in the presence of sunlight. Eye and throat irritation, coughing, respiratory tract problems, asthma, lung damage. Plant and ecosystem damage. Lead (Pb) Metallic element. Metal refineries, lead smelters, battery manufacturers, iron and steel producers. Anemia, high blood pressure, brain and kidney damage, neurological disorders, cancer, lowered IQ. Affects animals and plants, affects aquatic ecosystems. Particulate Matter (PM) Very small particles of soot, dust, or other matter, including tiny droplets of liquids. Diesel engines, power plants, industries, windblown dust, wood stoves. Eye irritation, asthma, bronchitis, lung damage, cancer, heavy metal poisoning, cardiovascular effects. Visibility impairment, atmospheric deposition, aesthetic damage.")
10
Global Climate Change Gas and diesel burning vehicles also contribute to global climate change. The Earth’s atmosphere acts like a blanket, trapping some of the sun’s heat near the planet’s surface. Without this natural insulation, the average temperature on Earth would be -18°C Vehicle emissions also contain CO2, an important Green house gas (GHG). If the atmosphere gets too thick with GHGs, too much heat gets trapped. That can mean problems for the whole world.
. If the atmosphere gets too thick with GHGs, too much heat gets trapped. That can mean problems for the whole world.")
11
Global Climate Change

12
How Global Warming Works
Carbon Dioxide (CO2) Fossil fuels (coal, oil, natural gas)
 Fossil fuels (coal, oil, natural gas)")
13
Example of the Greenhouse Effect
The Sun’s energy passes through the car’s windshield. This energy (heat) is trapped inside the car and cannot pass back through the windshield, causing the inside of the car to warm up.
 is trapped inside the car and cannot pass back through the windshield, causing the inside of the car to warm up.")
14
Difference GLOBAL WARMING
is the increase of the Earth’s average surface temperature due to a build-up of greenhouse gases in the atmosphere. CLIMATE CHANGE is a broader term that refers to long-term changes in climate, including average temperature and precipitation.

15
Global Atmospheric Concentration of CO2

16
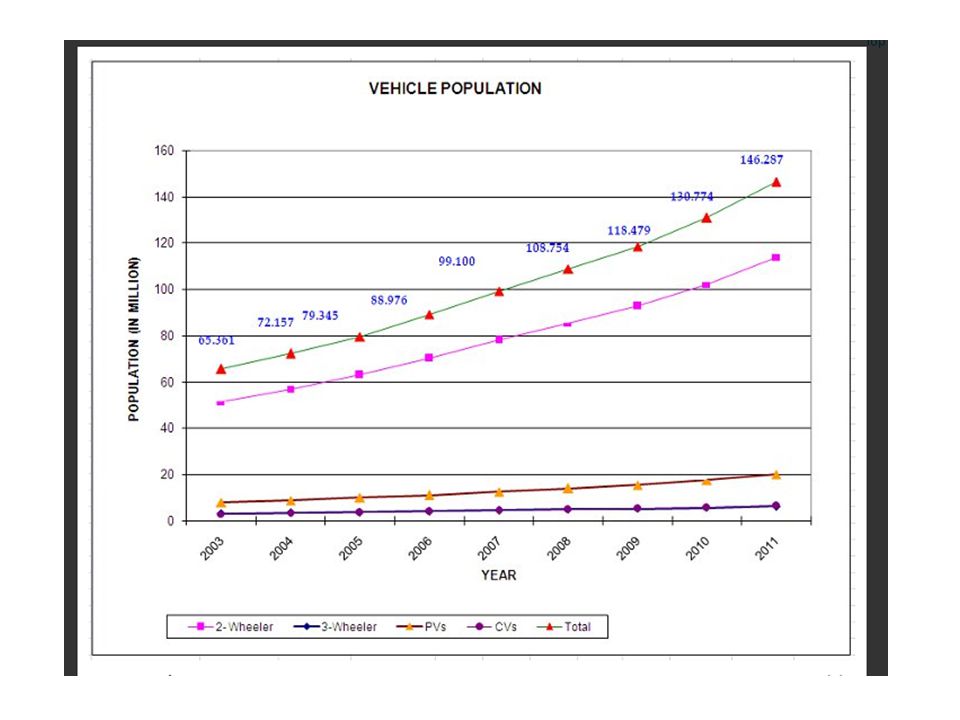
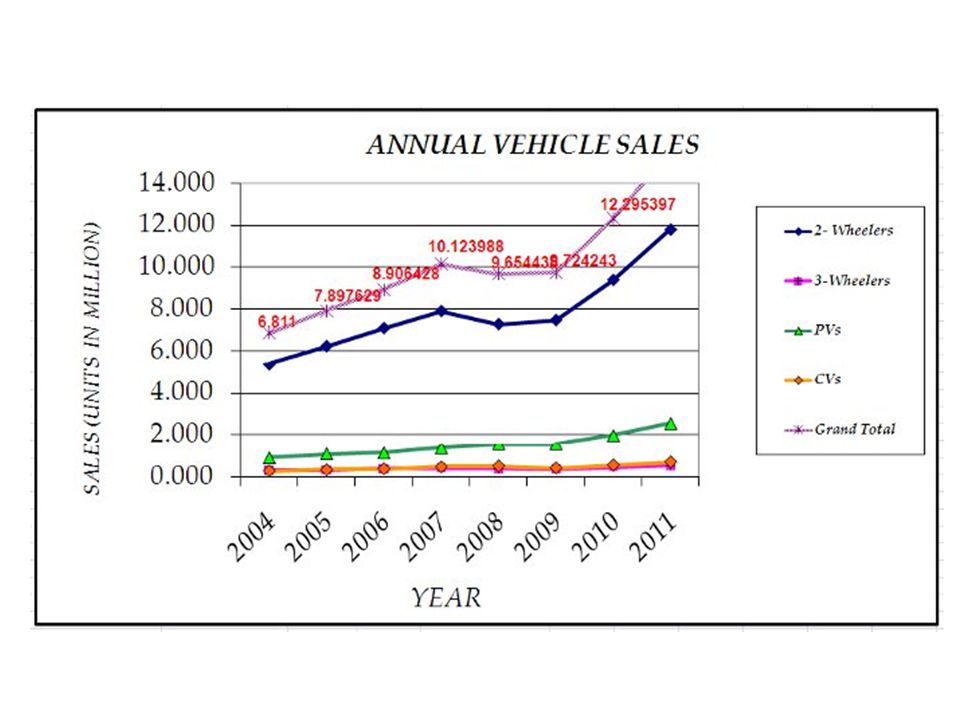
Indian Automobile Industry
Largest three wheeler market in the world 2nd largest two wheeler market in the world 7th largest passenger car market in Asia & 10th Largest in the world 4th largest tractor market in the world 5th largest commercial vehicle market in the world 5th largest bus & truck market in the world

20
Best of all, these actions are… S . I . M . P . L . E
There are many actions individuals can take to reduce their gas consumption. By saving gas, these actions are good for: respiratory health, helping clean the air, fighting climate change, and saving you money! Best of all, these actions are… S . I . M . P . L . E

21
S peed limit SSS Reduce your driving speed: The best fuel economy for most vehicles is 90 km/h. Reducing your speed from 100 km/h to 90 km/h improves fuel economy by 10% and from 120 km/h to 90 km/h can save 23% on fuel consumption. .REDUCE YOUR DRIVING SPEED - as you increase speed beyond 90 km/h, the increase in your fuel consumption goes up faster than your increase in speed. That is, travelling at 100km/h uses more gas that travelling at 90km/h; but, you use much more gas to go 110km/h instead of 100km/h, even though it is still only 10km/hr faster .AVOID AGGRESSIVE DRIVING - basically by taking-off and stopping quickly, you will use a lot more gas, and actually save very little time Avoid aggressive driving: Aggressive driving, rapid acceleration, or quick stops has been shown to increase fuel use by about 39%, and saves about 4% of your time.

22
I dling II Avoid idling: Excessive idling pollutes. Turn off the engine whenever you can. If you are stopped for more than ten seconds, turn it off. In the winter, the most effective way to warm up a cold vehicle is to drive it. Idle for 30 seconds and then drive away for optimum performance and fuel efficiency. AVOID IDLING - Many people idle because of an old wives tale that says it takes 3 or 5 minutes worth of gas to start a car, so you might as well leave it sunning for short stops. However, it actually only takes about 10 seconds of gas, so unless you are in traffic, your better off to turn your car off. Excessive idling is also bad for your engine. Also, avoid drive throughs! Park you car and walk in. Five minutes of idling at a drive though uses enough gas to fill a coffee cup!

23
MMM M atch vehicle to need
Do you need a vehicle?: You could save yourself a lot of money and time by evaluating if you even need a vehicle. Maybe you could take the bus? Or walk to your destinations? What do I need the car for?: This would help you find out what kind of car you need. Do you need a truck for work? Do you just need something small to get into town? Do you need a van because you have a large family? .MATCH VEHICLE TO NEED - The main point of these slides is to encourage people to make commuting choices that balance their needs with the vehicle they choose. DO I NEED A VEHICLE? - perhaps they can either walk, bike, bus, carpool, or some combination of these. Also, maybe they consider walking two days of the week. Every little bit helps! WHAT DO I NEED THE CAR FOR? - Look for the most efficient vehicle that meets your needs. In general, when comparing vehicles, smaller is more efficient, and newer is more efficient. This doesn’t mean that the smallest brand new car works for everyone, but does one or two people need a minivan? Or if you drive a big truck everyday, even though you only need it to tow the noat to the cottage twicw a year, couldn’t you drive a smaller vehicle all year and rent the large truck for the few times you actually need it? SHOULD I BUY NEW OR USED? - From a fuel efficiency point of view, people should buy the newest vehicle that fits their budget. It is interesting to note that the oldest 15% of vehicles on the road produce half of the vehicle emissions! This is do in part to the fact that the government issues new emission standards every few years.

24
? MM M atch vehicle to need
Should I buy a used car or a new car? Older cars can be less expensive, but can also be bad for the environment and bad on fuel. New cars produce less emission and are more fuel efficient. ?

25
P ressure PP Check tire pressure: 5% of under-inflation = 1% decrease in fuel efficiency. Under-inflation of 20% will reduce the life of your tire by about 15%. *4 tires 15% under-inflated = 12% fuel waste! PRESSURE: Step 1: Find the recommended inflation pressure for your tires on the vehicle placard. Check the owner’s manual for its exact location. Step 2: Only measure pressure when your tires are cold. "Cold" means that your tires have been stationary for at least three hours or your car has not been driven more than 2 km. Step 3: Complete tire inflation pressure measurement: Remove cap from valve on one tire, press tire gauge onto valve and take pressure reading. Add air to achieve recommended air pressure. If you overfill the tire, release air by pushing on the metal stem in the centre of the valve, then re-check the pressure. Replace the valve cap and repeat with each tire, including the spare.

26
L eave your car at home Reduce your number of trips: The best way to reduce fuel use and save money is by planning activities and combining errands to reduce the number of trips. Leave you car at home: - Regarding the bus, people often tell me that the bus appears to be a lot more polluting than their car. This appears to make sense on the surface - a passenger car has a much smaller engine that a big bus, and burns less fuel. However, we should not compare 1 bus to 1 car, as the bus can transport many more people than the car, and you were to compare the equivalent number of cars it would take to carry all those people, the bus will be much less polluting.

27
EE E ngine tune up Regular tune-ups: A poorly tuned engine can consume an average of 10% more fuel. One poorly tuned vehicle can emit pollutants equivalent to 20 properly tuned vehicles.

28
E EE ngine tune up Regular tune-ups: A poorly tuned engine can consume an average of 10% more fuel. One poorly tuned vehicle can emit pollutants equivalent to 20 properly tuned vehicles. Clean or replace air filters and spark plugs: Clean filters and spark plugs help keep fuel use and greenhouse gas emissions down. Have your idle mixture and idle speed adjusted: Adjusting idle speed according to vehicle specifications on pre-1988 vehicles can decrease greenhouse gas emissions during idling.

29
ther factors O Maintain braking systems: Dragging brakes can decrease fuel efficiency by up to 40%. Minimize air conditioner use: Using air conditioning can increase fuel consumption and greenhouse gas emissions by up to 21%. Maintain wheel alignment: Make sure wheels are aligned and balanced, and ball joints or constant velocity joints are lubricated.

30
ther factors O Travel light: The heavier the vehicle, the more fuel it burns. Avoid unnecessary weight. Use overdrive and high gears: While driving, strive for the lowest engine rpm at a given road speed by selecting the highest gear in which the vehicle will operate properly. Operate overdrive automatic transmissions in the overdrive mode. Be aerodynamic: Reducing wind resistance on the highway by rolling up the windows cuts fuel consumption.

31
ther factors O Have your oxygen sensor checked: Vehicles made in 1988 or after should have the oxygen sensor checked regularly. When this sensor malfunctions, the computer could increase the fuel ration to burn more fuel and thus increasing greenhouse gas emissions. Replace or service the EGR valve: The exhaust gas recirculator (EGR) valve reduces a variety of greenhouse gases. Use a timed block heater: Improve fuel efficiency by 8 to 23% with a block heater at below 0oC. Set timer for 2.5 hours before you leave.
 valve reduces a variety of greenhouse gases. Use a timed block heater: Improve fuel efficiency by 8 to 23% with a block heater at below 0oC. Set timer for 2.5 hours before you leave.")
32
Pollution from S.I. Engine
UNIT II Pollution from S.I. Engine Products of Complete Products of Incomplete Combustion Combustion NOx SOx Lead CO HC Parti Lead culates

33
I.C. Engine & Environment
COx HC NOx Lead SOx Particulates CO CO CH Others N2O NO NO SO SO3 Particles Smoke Poison Aerosols Soot Poison GHG GHG Carcinogens GHG P C Smog P C Smog Visibility Acid Rain Acid Rain P C Smog OD GHG Acid Rain Visibility Irritation

34
FOR THE S.I. ENGINE WITH CARBURETOR:
S.I. ENGINE EMISSIONS EVAPORATIVE CRANKCASE EXHAUST FUEL CARB CO, HC, NOX, PART. TANK FLOAT BOWL UBHC UBHC FOR THE S.I. ENGINE WITH CARBURETOR: EVAPORATIVE EMISSIONS ACCOUNT FOR APPROXIMATELY 20% CRANKCASE EMISSIONS ACCOUNT FOR APPROXIMATELY % EXHAUST EMISSIONS ACCOUNT FOR THE BALANCE %

35
Vehicular Emissions

36
The Internal Combustion Engine and Atmospheric Pollution
Type of Pollution Principal Sources Relevance of the I.C. Engine Lead Anti-knock compounds A (for the SI Engine) Carcinogens Diesel exhaust A Acid Rain Sulfur dioxide B (for the CI Engine) Oxides of nitrogen A Unburned hydrocarbons A (for the SI Engine) Carbon monoxide A (for the SI Engine) Global warming CFCs B (for car with A/c) (or else not involved) Carbon dioxide B (may be even A) Methane B (may be A if CNG used) Photochemical smog Carbon monoxide A (for the SI Engine) Unburned hydrocarbons A (for the SI Engine) Sulfur dioxide B (for the CI Engine) Oxides of nitrogen A Ozone depletion CFCs B (for car with A/c) Unburned hydrocarbons A (for the SI Engine) A: Major contributor B: Secondary influence
 Carcinogens Diesel exhaust A. Acid Rain Sulfur dioxide B (for the CI Engine) Oxides of nitrogen A. Unburned hydrocarbons A (for the SI Engine) Carbon monoxide A (for the SI Engine) Global warming CFCs B (for car with A/c) (or else not involved) Carbon dioxide B (may be even A) Methane B (may be A if CNG used) Photochemical smog Carbon monoxide A (for the SI Engine) Unburned hydrocarbons A (for the SI Engine) Sulfur dioxide B (for the CI Engine) Oxides of nitrogen A. Ozone depletion CFCs B (for car with A/c) Unburned hydrocarbons A (for the SI Engine) A: Major contributor. B: Secondary influence.")
37
UNIT III EVAPORATIVE EMISSIONS

38
(in engines fitted with carburetors) of parked vehicles.
Major Sources: Dirunal Emissions Take place from fuel tanks and carburetor float bowls (in engines fitted with carburetors) of parked vehicles. It draws in air at night as it cools down Expels air and gasoline vapour as it heats up during the day. These could be up to 50g per day on hot days.
 of parked vehicles. It draws in air at night as it cools down. Expels air and gasoline vapour as it heats up during the day. These could be up to 50g per day on hot days.")
39
The residual thermal energy of the engine heats up
Hot Soak Emissions This occurs after an engine is shut down. The residual thermal energy of the engine heats up the fuel system leading to release of fuel vapours.

40
when the car is driven and the fuel tank becomes hot.
Running Losses Gasoline vapours are expelled from the tank (or float bowl) when the car is driven and the fuel tank becomes hot. This can be high if the ambient temperature is high.
 when the car is driven and the fuel tank becomes hot. This can be high if the ambient temperature is high.")
41
Filling Losses (Refueling Losses)
Gasoline vapours can escape when the vehicle is being refueled in the service station.

42
“Evaporative emissions increase significantly
if the fuel volatility increases”

43
Evaporative emissions are tested in the
“Sealed Housing Evaporative Determination – SHED” test procedure evolved in the US. Vehicle is placed in the enclosure and emissions are measured as the temperature in the fuel tank is increased. This gives diurnal emissions. Running losses are determined by running the vehicle on a chassis dynamometer with absorbent charcoal canisters attached at various possible emission sources. The latest procedure involves running the vehicle through 3 standard driving cycles in the SHED. The hot soak test measures emissions for one hour immediately following the hot soak test. Acceptable losses from the complete procedure are 2g of fuel per test for US, Europe and India.

44
Evaporative Emission Control:
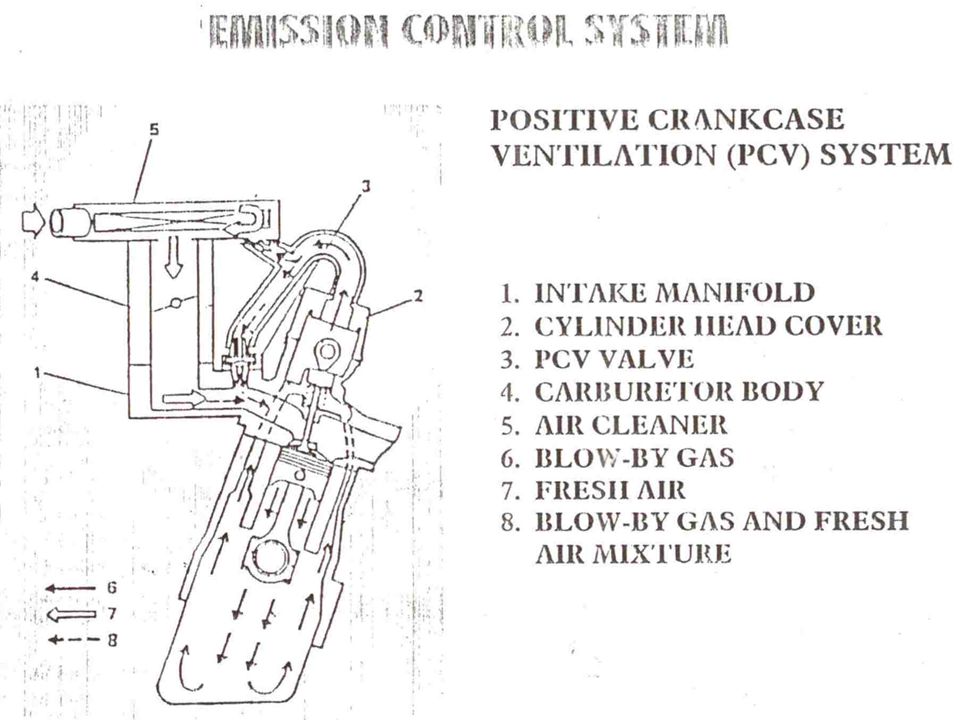
Positive Crankcase Ventilation (PCV) System (for crankcase emissions) Charcoal Canister System (for Fuel tank and carburetor float bowl emissions)
 System. (for crankcase emissions) Charcoal Canister System. (for Fuel tank and carburetor float bowl emissions)")
47
Exhaust Emissions: CO NO HC

50
Levels of CO observed are lower than the maximum values
CO Formation Primarily dependent on the equivalence ratio. Levels of CO observed are lower than the maximum values measured within the combustion chamber but are significantly higher than equilibrium values for the exhaust conditions The processes which govern CO exhaust levels are kinetically controlled The rate of re-conversion from CO to CO2 is slower than the rate of cooling. This explains why CO is formed even with stoichiometric and lean mixtures.

52
There is a temperature distribution across the chamber due to passage
NO Formation: There is a temperature distribution across the chamber due to passage of flame. Mixture that burns early is compressed to higher temperatures after combustion, as the cylinder pressure continues to rise. Mixture that burns later is compressed primarily as unburned mixture and ends up after combustion at a lower burned gas temperature. Using the NO formation kinetic model based on the extended Zeldovich mechanism: O + N2 NO + N N + O2 NO + O N + OH NO + H

53
Assuming equilibrium concentrations for O, O2, N2, OH and H
corresponding to the equivalence ratio and burned gas fraction of the mixture we obtain the rate-limited concentration profile. The NO concentration corresponding to chemical equilibrium can also be obtained. The rate-controlled concentrations arise from the residual gas NO concentration, lagging the equilibrium levels, then cross the equilibrium levels and “freeze” well above the equilibrium values corresponding to exhaust conditions. Depending on details of engine operating conditions, the rate limited concentrations may or may not come close to equilibrium levels at peak cylinder pressure and gas temperature. The amount of decomposition from peak NO levels, which occurs during expansion depends on engine conditions as well as whether the mixture element burned early or late. The earlier burning fractions of the charge contribute much more to the exhausted NO than do later burning fractions of the charge.

54
Frozen NO concentrations in these early-burning elements can be
an order of magnitude higher than concentrations in late burning elements. In the absence of vigorous bulk gas motion, the highest NO concentrations occur nearest the spark plug. These descriptions of NO formation in the SI engine have been confirmed by experimental observations.

56
Among the major engine variables that affect NO emissions are
Equivalence Ratio Burned gas fraction (Residual gas plus EGR if any) Excess air Spark Timing
 Excess air. Spark Timing.")
60
HC Formation: The sequence of processes involved in the engine out HC emissions is: Storage In-cylinder post-flame oxidation Residual gas retention Exhaust oxidation HC Sources Quench Layers Quenching contributes to only about 5-10% of total HC. However, bulk quenching or misfire due to operation under dilute or lean conditions can lead to high HC. Quench layer thickness has been measured and found to be in the range of 0.05 to 0.4 mm (thinnest at high load) when using propane as fuel. Diffusion of HC from the quench layer into the burned gas and subsequent oxidation occurs, especially with smooth clean combustion chamber walls.
 when using propane as fuel. Diffusion of HC from the quench layer into the burned gas and subsequent oxidation occurs, especially with smooth clean combustion chamber walls.")
61
Crevices These are narrow volumes present around the surface of the combustion chamber, having high surface-to-volume ratio into which flame will not propagate. They are present between the piston crown and cylinder liner, along the gasket joints between cylinder head and block, along the seats of the intake and exhaust valves, space around the plug center electrode and between spark plug threads. During compression and combustion, these crevice volumes are filled with unburned charge. During expansion, a part of the UBHC-air mixture leaves the crevices and is oxidized by the hot burned gas mixture. The final contribution of each crevice to the overall HC emissions depends on its volume and location relative to the spark plug and exhaust valve.

62
3. Lubricant Oil Layer The presence of lubricating oil in the fuel or on the walls of the combustion chamber is known to result in an increase in exhaust HC levels. The exhaust HC was primarily unreacted fuel and not oil or oil-derived compounds. It has been proposed that fuel vapor absorption into and desorption from oil layers on the walls of the combustion chamber could explain the presence of HC in the exhaust. 4. Deposits Deposit buildup on the combustion chamber walls (which occurs in vehicles over several thousand kilometers) is known to increase UBHC emissions. Deposit buildup rates depend on fuel and operating conditions. Olefinic and aromatic compounds tend to have faster buildup than do paraffinic compounds.
 is known to increase UBHC emissions. Deposit buildup rates depend on fuel and operating conditions. Olefinic and aromatic compounds tend to have faster buildup. than do paraffinic compounds.")
63
5. Liquid Fuel and Mixture Preparation – Cold Start
The largest contribution (>90%) to HC emissions from the SI engine during a standard test occurs during the first minute of operation. This is due to the following reasons: The catalytic converter is not yet warmed up A substantially larger amount of fuel is injected than the stoichiometric proportion in order to guarantee prompt vaporization and starting Poor Combustion Quality Flame extinction in the bulk gas before the flame front reaches the wall is a source of HC emissions under certain engine operating conditions.
 to HC emissions from the SI engine during. a standard test occurs during the first minute of operation. This is due to the following reasons: The catalytic converter is not yet warmed up. A substantially larger amount of fuel is injected than the stoichiometric. proportion in order to guarantee prompt vaporization and starting. Poor Combustion Quality. Flame extinction in the bulk gas before the flame front reaches the wall is a. source of HC emissions under certain engine operating conditions.")
67
Smog Smog is can be a major problem in larger cities (New York and LA)
Smog can be harmful to A. Humans B. Plants C. Animals and even effect paint rubber and other materials.

68
Smog One of largest producer of photochemical smog is the automotive internal combustion engine. The EPA (environmental protection agency) begin putting restriction on automotive manufactories in the mid 60.
 begin putting restriction on automotive manufactories in the mid 60.")
69
Motor Vehicle Emissions
Motor vehicle emission are emission produce by motor vehicles. They include A. Hydrocarbons (HC) Carbon monoxide (CO) Oxides of nitrogen (NOx)
 Carbon monoxide (CO) Oxides of nitrogen (NOx)")
70
Exhaust Gasses Hydrocarbons (HC) are emission of unburned petroleum products being released into the atmosphere. All petroleum products and made of hydrocarbons (hydrogen and carbon compounds) this includes: Gasoline LP-gas. Diesel motor oil.
 this includes: Gasoline LP-gas. Diesel motor oil.")
71
Exhaust Gasses Hydrocarbons are produced because of incomplete fuel combustion or fuel evaporation. Hydrocarbons emission is considered a hazardous form of air pollution because of. Eye. Throat. Lung irritation. And possibility cancer.

72
Exhaust Gasses In north Carolina a vehicle must not exceed 220 ppm of hydrocarbons emissions. High hydrocarbon emission are the results of a: cylinder misfire. Improper ignition timing Worn cylinder rings (pumping oil into the combustion chamber

73
Exhaust Gasses Carbon monoxide emission are exhaust emission that is the result of partially burned fuel. A high carbon monoxide emission can be caused by a: Restricted or dirty air cleaner. Advance ignition timing. Clogged fuel injectors.

74
Exhaust Gasses Oxides of nitrogen, (NOx) are emission produced by extreme heat. Air consist of approximately 79% nitrogen and 21% oxygen When combustion chamber temperature reaches 2500 degrees F or 1370 degrees C nitrogen and oxygen combine to produce oxide of nitrogen (NOx)
")
75
UNIT IV In North Carolina the standard for Carbon Monoxide is 1.2 % of the total exhaust output. Muffler HC 220 ppm CO 1.2% Exhaust output

76
Exhaust Gasses Oxides of nitrogen is responsible for the dirty brown color is SMOG. NOx is a eye and respiratory irritant. Newer high compression, learn air fuel mixture and hotter running engine produces more NOx than earlier engine.

77
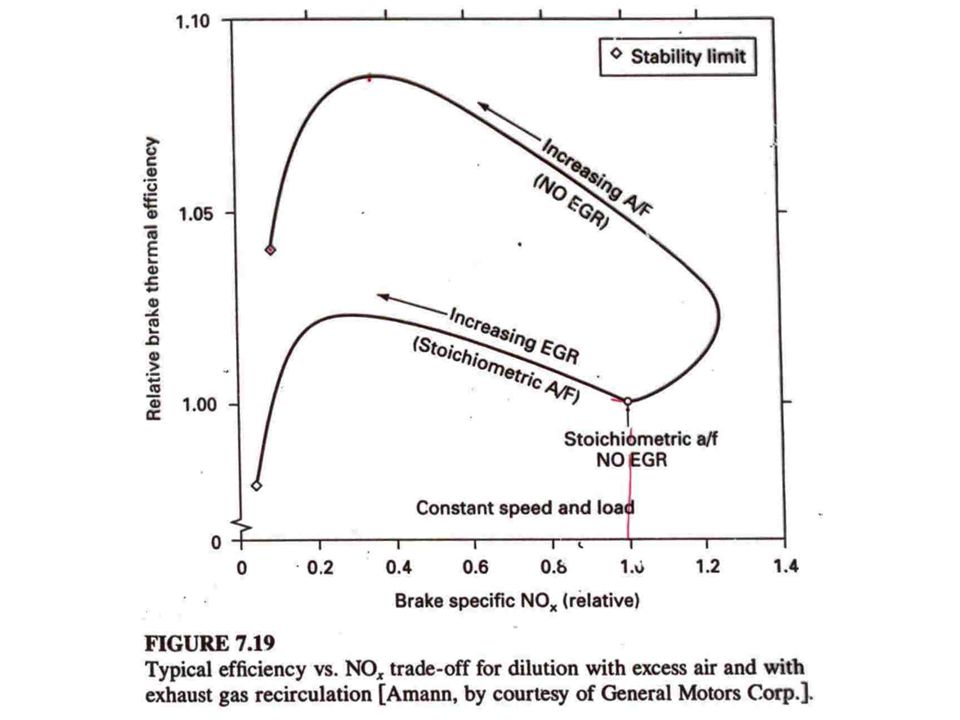
Exhaust Gasses The same factors that increases NOx will tend to improve fuel mileage and lower HC and CO2 production. This means that to increase fuel economy and lower HC and CO2 production NOx will increase. For this reason emission controls have beedn added to lower all form of emissions

78
Exhaust Gasses HC increases NOx increases Richer Leaner 14.7 – 1 AFR
Hc and Co decreases NOx decreases

79
Exhaust Gasses Before understanding emission controls we need to first understand where they come from. Particulates: are solid particle of carbon soot and fuel additives that blow out the tail pipe. Engine crank case blow by. Caused by heating of oil and unburned fuel vapors that blow past the engine rings.

80
Exhaust Gasses Fuel vapors: different chemicals that enter the atmosphere as fuel evaporates. Engine exhaust gasses: are harmful chemical that are produced inside the combustion chamber and are blow outr the tail pipe.

81
HC CO Catalytic Converter Exhaust manifold Fuel Tank Air Fuel Pump
Solid particulate Catalytic Converter Exhaust manifold Fuel Tank Air Fuel Pump Fuel Fuel Vapors Fuel

82
Exhaust Gasses Automotive manufactures agree the best way to lower exhaust emission is to burn all the fuel entering the combustion chamber. Modern engine have introduced several modification to ensure all fuel entering the combustion chamber is burned.

83
Exhaust Gasses Some engine modification are:
Lower compression ratio, by lowering compression ratio vehicle can burn unleaded fuel. The use of unleaded fuel allows for catalytic converters that help reduce HC and CO emissions. Lower compression ratio also lower combustion temperature reducing NOx emission.

84
Exhaust Gasses Smaller combustion chambers, allows for more heat to remain inside the combustion chamber that can aid in the burning of fuel. Reduce quench areas, the areas between the piston and the cylinder head is the quench area. If this areas is to close fuel will not burn completely increasing HC and CO emissions. Modern engine are design to reduce high quench areas.

85
Exhaust Gasses Quench area

86
Exhaust Gasses Decrease valve overlap, is used to decrease exhaust emission. A larger valve overlap increases power but dilutes incoming fuel mixture and requires a richer air fuel mixture at lower engine speed therefore increasing HC and CO emissions.

87
Exhaust Gasses Overlap Intake Exhaust

88
Exhaust Gasses Higher combustion chamber temperature, are used to reduce HC and CO emissions. Today vehicles used hot thermostats than earlier model helping to increase combustion chamber temperature. Leaner air-fuel mixtures help fuel burn better lower HC and CO emissions. Wider spark plug gaps, are used to burn the leaner fuel mixture and helps prevent spark plug fouling.

89
Exhaust Gasses Thermostats are now 190 degrees Wider spark plug gap
Some are .080 thousands

90
What is NOx NOx is actually a generic term for a group of gases called nitrogen oxides. It is a mixture of gases which consists of nitric oxide (NO), dinitrogen dioxide (N2O2), nitrous oxide (N2O), dinitrogen trioxide (N2O3), nitrogen dioxide (NO2), dinitrogen tetroxide (N2O4) and dinitrogen pentoxide (N2O5). In most high-temperature combustion processes, the majority (95%) of NOx produced is in the form of nitric oxide (NO)
, dinitrogen dioxide (N2O2), nitrous oxide (N2O), dinitrogen trioxide (N2O3), nitrogen dioxide (NO2), dinitrogen tetroxide (N2O4) and dinitrogen pentoxide (N2O5). In most high-temperature combustion processes, the majority (95%) of NOx produced is in the form of nitric oxide (NO)")
92
NOx is a major cause of ground- level ozone (smog), acid rain, respiratory disease (emphysema and bronchitis), water quality deterioration, and global warming. Worldwide biodiesel production is around 5 billion gallons (19 billion litres) and in 2020 it will be billion litres. As the use of biodiesel has increased tremendously, the increase in NOx emissions could become a significant barrier to market expansion.
 and in 2020 it will be billion litres. As the use of biodiesel has increased tremendously, the increase in NOx emissions could become a significant barrier to market expansion.")
93
NOx Formation Mechanisms
Thermal (Zeldovich) prompt (Fenimore) Fuel N2O pathway Thermal NOx Thermal NO formation mechanism is the dominant source of NOx in combustion system. It is formed by the reaction of atmospheric nitrogen with oxygen due to combustion at elevated temperatures (above1800K).
 prompt (Fenimore) Fuel. N2O pathway. Thermal NOx. Thermal NO formation mechanism is the dominant source of NOx in combustion system. It is formed by the reaction of atmospheric nitrogen with oxygen due to combustion at elevated temperatures (above1800K).")
94
The three reactions producing thermal NO proposed by Zeldovich are:
N2 + O ↔ NO + N (1) N + O2 ↔ NO + O (2) N + OH ↔ NO + H (3) The NO formation rate can be approximated by: [NO] = k e-K/T [N2] [O2]1/2 t (4) Where: k and K are reaction constants, T is absolute temperature, and t is time. The Eq. (4) indicates that thermal NO formation is an exponential function of temperature. The other factors that influence thermal NO formation rate are oxygen, nitrogen concentrations and residence time of reaction products.
 N + O2 ↔ NO + O (2) N + OH ↔ NO + H (3) The NO formation rate can be approximated by: [NO] = k e-K/T [N2] [O2]1/2 t (4) Where: k and K are reaction constants, T is absolute temperature, and t is time. The Eq. (4) indicates that thermal NO formation is an exponential function of temperature. The other factors that influence thermal NO formation rate are oxygen, nitrogen concentrations and residence time of reaction products.")
95
Prompt NOx Prompt NO is generally an important mechanism in low temperature, fuel-rich combustion processes where residence times are short. The free radicals in the flame front of hydrocarbon flames leads to rapid production of NO. The prompt NO contribution to total NO from combustion process is considered less important when compared to thermal NO. However, in biodiesel combustion, significant quantities of NO are formed by prompt mechanism

96
CH + N2 ↔ HCN + N (5) C2 + N2 ↔ 2CN (6) CN+O2 ↔ NO + CO (7) Such reactions require relatively low activation energy and the rate of NO formation is very rapid which is comparable to that of the oxidation of fuel. This means that NO formation can takes place even at much lower temperatures (below 750°C). The rate of HCN and NO formation increases with the concentration of hydrocarbon radicals.
. The rate of HCN and NO formation increases with the concentration of hydrocarbon radicals.")
97
Fuel NOx The major source of NOx production from nitrogen-bearing fuels such as certain coals and oil, is the conversion of fuel bound nitrogen to NOx during combustion. Biodiesel molecule does not contain nitrogen in its structure and hence formation of NOx by fuel bound oxygen is negligible.

98
N2O Pathway In this mechanism, the atomic oxygen reacts with N2 to form N2O by a three body reaction. O + N2 + M ↔ N2O + M (8) where M is a molecule that is required to complete this reaction. The N2O formed in the reaction (8) can then react to form NO. N2O + O ↔ NO + NO (9) This mechanism is important in combustion process under elevated pressure and lean air fuel ratio conditions.
 where M is a molecule that is required to complete this reaction. The N2O formed in the reaction (8) can then react to form NO. N2O + O ↔ NO + NO (9) This mechanism is important in combustion process under elevated pressure and lean air fuel ratio conditions.")
99
Reasons for Increase in NOx
High isentropic bulk modulus of biodiesel The high isentropic bulk modulus of biodiesel causes an artificial advance in injection timing relative to petrodiesel, and higher NOx emissions. However, Zhang and Boehman found much higher NOx emissions with common rail system, and concluded that injection timing shift alone could not be the reason for biodiesel NOx effect.

100
Fuel-bound Oxygen Biodiesel is an oxygenated fuel containing 11% of oxygen by weight. High oxygen content of biodiesel promotes combustion efficiency and reduces emissions of CO, PM, HC and other pollutants. However, many early studies suggested that high combustion efficiency leads to high reaction temperature and more Thermal NOx formation.

101
Reduced radiative heat transfer from in-cylinder soot
Biodiesel combustion generally produces lesser soot than conventional diesel because of fuel bound oxygen, reduced aromatic content, absence of sulphur, and unsaturated fatty acid contents. The reduced soot formation may lessen radiative heat transfer from soot particles which results in elevated reaction temperature and more NOx. To reduce the biodiesel NOx effect, decreasing the fuel bound oxygen content may not be the right strategy because the presence of oxygen not only reduces particulate matter and also mutagenicity of the soot particles.

102
More Stoichiometric Combustion and High Heat Release Rate
Mueller et al. observed increased stoichiometric burning of biodiesel combustion which could lead to rise in temperature and NOx. Higher heat release rate of biodiesel (Yu et al.)
")
103
High Adiabatic Flame Temperature
The adiabatic flame temperature of biodiesel is reported to have slightly higher than petrodiesel due to complete combustion resulting from fuel bound oxygen.

104
High Unsaturated Fatty Acids Content
Iodine number (IV) is a measure of degree of unsaturation of the fatty acid; a high iodine number indicates a high degree of unsaturation. McCormick et al. investigated the relationship between NOx emissions and Iodine value and revealed that NOx increases with iodine value of biodiesel.
 is a measure of degree of unsaturation of the fatty acid; a high iodine number indicates a high degree of unsaturation. McCormick et al. investigated the relationship between NOx emissions and Iodine value and revealed that NOx increases with iodine value of biodiesel.")
105
Base Oil Iodine Value Change in NOx Coconut oil 7-12 -20.5 Palm oil 48-55 -5 Soybean oil 130 +11 Sunflower oil 134 +13 Rapeseed oil 101 +8 Lard Oil 62.5 +4

106
Higher Boiling Point of Biodiesel Fuel
Boiling point of bio-diesel is higher than diesel fuel. Because of higher boiling point, biodiesel retains its liquid state for an increased duration, facilitating more droplet penetration into the engine cylinder. This feature can lead to increased fuel consumption, peak temperature and higher NOx.

107
Increased Formation of Free Radicals (Prompt NOx)
CH and OH radicals are continuously formed during combustion reactions. The formation of CH-radicals is an indicator of low temperature pre-combustion reactions, which is the first step for the combustion process, once fuel is evaporated. OH radicals are formed during high temperature reactions and are located in the flame front, where vapourized fuel reaches the highest temperatures. Violi et al. (Michigan University) and Brezinsky et al. (Iowa State University) found the increased rate of CH radical formation and lower rate of OH radical generation in biodiesel combustion.
 and Brezinsky et al. (Iowa State University) found the increased rate of CH radical formation and lower rate of OH radical generation in biodiesel combustion.")
108
CH + N2 ↔ HCN + N (5) C2 + N2 ↔ 2CN (6) CN+O2 ↔ NO + CO (7) The increased rate of CH radical formation, lower rate of OH radical generation and NTC (Negative temperature coefficient) behaviour of biodiesel, indicates that biodiesel combustion is a low temperature reaction when compared to mineral diesel combustion. Therefore factors such as elevated adiabatic flame temperature, higher heat release rate and stoichiometric burning might not be the major reasons for biodiesel NOx effect.
 behaviour of biodiesel, indicates that biodiesel combustion is a low temperature reaction when compared to mineral diesel combustion. Therefore factors such as elevated adiabatic flame temperature, higher heat release rate and stoichiometric burning might not be the major reasons for biodiesel NOx effect.")
109
Biodiesel NOx Control Strategies
Post-combustion Combustion control techniques Post Combustion Techniques Popular post-combustion technologies include selective non-catalytic reduction (SNCR), selective catalytic reduction (SCR) and exhaust gas recirculation (EGR).
, selective catalytic reduction (SCR) and exhaust gas recirculation (EGR).")
110
Selective Non-Catalytic Reduction (SNCR)
The process involves injecting either ammonia or urea into the flue gas is between 1,400 and 2,000 °F (760 and 1,093 °C) to react with the nitrogen oxides formed in the combustion process. NH2CONH2 + H2O -> 2NH3 + CO2 4 NO + 4 NH3 + O2 -> 4 N2 + 6 H2O At temperatures above 1093 °C ammonia decomposes: 4 NH3 + 5 O2 -> 4 NO + 6 H2O Practical constraints of temperature, time, and mixing often lead to worse results in practice. However, selective non-catalytic reduction has an economical advantage over selective catalytic reduction, as the cost of the catalyst is not there.
 to react with the nitrogen oxides formed in the combustion process. NH2CONH2 + H2O -> 2NH3 + CO2. 4 NO + 4 NH3 + O2 -> 4 N2 + 6 H2O. At temperatures above 1093 °C ammonia decomposes: 4 NH3 + 5 O2 -> 4 NO + 6 H2O. Practical constraints of temperature, time, and mixing often lead to worse results in practice. However, selective non-catalytic reduction has an economical advantage over selective catalytic reduction, as the cost of the catalyst is not there.")
111
Selective Catalytic Reduction (SCR)
The temperature range and reaction time of Urea are reduced with the help of catalysts. Oxides of base metals (vanadium molybdenum and tungsten), zeolites, or various precious metals.
, zeolites, or various precious metals.")
112
Exhaust Gas Recirculation (EGR)
EGR works by recirculating a portion of an engine's exhaust gas back to the engine cylinders and hence reduces the peak temperature and NOx. A drastic NOx reduction of about 41.4–65.2% at 12–20% EGR rate was obtained with decreasing HC, smoke and CO2, but increasing BSFC compared with neat diesel combustion without EGR.

113
Combustion Control Techniques
Retardation of injection timing Water - fuel emulsion method Water injection method Use of Antioxidant Additives

114
Retardation of Injection Timing
Monyem et al. have shown a 35% reduction in NOx emissions for a 6° retardation in injection and Ren and Li found a significant reduction with preheated biodiesel. The ignition timing retardation also leads to an increase in soot or PM emissions and hence would require recertification of the engine for emissions standard compliance.

116
Water - fuel emulsion method
Namasivayam et al. reported that water–biodiesel emulsion reduces smoke and NOx emissions significantly in CI engines. However, the presence emulsion in fuels decreases the volumetric energy content which causes a reduction in fuel economy.

117
Water Injection Method
Water injection into the combustion chamber is another important method for controlling NOx emission from internal combustion engines. Water injection method reduces NOx emission by up to 50% for both diesel and biodiesel fuelled engines with a slight increase in CO and BSFC, as well as a decrease in BTE.

118
Use of Antioxidant Additives
The free radicals formation during combustion determines the rate of reaction and prompt NOx production. Free radical is a highly reactive molecule with one or more unpaired electrons. The most important reactive radicals formed during combustion reactions are hydroperoxyl (•OOH), hydroxyl (HO•), alkoxyl (RO•) and peroxyl (ROO•) radicals. These radicals react with N2 and N2O forming nitrogen oxides. Antioxidant delays or inhibits oxidative processes by donating an electron or hydrogen atom to a radical derivative.
, hydroxyl. (HO•), alkoxyl (RO•) and peroxyl (ROO•) radicals. These radicals react with N2 and N2O forming nitrogen oxides. Antioxidant delays or inhibits oxidative processes by donating an electron or hydrogen atom to a radical derivative.")
119
UNIT V Additions of small amounts of antioxidants into the fuel suppress free radical formation by reacting with peroxyl radicals to form new inactive radicals so interrupting the propagation step. The hydrogen is released from the weak OH (phenols, hydroquinones) and NH (aromatic amines, diamines) bonds of antioxidants.
 and NH (aromatic amines, diamines) bonds of antioxidants.")
120
Incineration Incineration, also known as combustion, is most used to control the emissions of organic compounds from process industries. This control technique refers to the rapid oxidation of a substance through the combination of oxygen with a combustible material in the presence of heat. When combustion is complete, the gaseous stream is converted to carbon dioxide and water vapor. Equipment used to control waste gases by combustion can be divided in three categories: Direct combustion or flaring, Thermal incineration and Catalytic incineration.

121
Direct combustor Direct combustor is a device in which air and all the combustible waste gases react at the burner. Complete combustion must occur instantaneously since there is no residence chamber. A flare can be used to control almost any emission stream containing volatile organic compounds. Studies conducted by EPA have shown that the destruction efficiency of a flare is about 98 percent.

122
In thermal incinerators the combustible waste gases pass over or around a burner flame into a residence chamber where oxidation of the waste gases is completed. Thermal incinerators can destroy gaseous pollutants at efficiencies of greater than 99 percent when operated correctly. Thermal incinerator general case

123
Catalytic incinerators are very similar to thermal incinerators
Catalytic incinerators are very similar to thermal incinerators. The main difference is that after passing through the flame area, the gases pass over a catalyst bed. A catalyst promotes oxidation at lower temperatures, thereby reducing fuel costs. Destruction efficiencies greater than 95 percent are possible using a catalytic incinerator. Catalytic incinerator

124
One of the reactions that takes place in the catalytic converter
The platinum-rhodium catalyst provides a surface on which NO decomposes. The catalyst surface is large because it coats the surface of a honeycomb structure seen in the cutaway view of a catalytic converter. Catalytic converters are required on all new cars manufactured in the United States. A converter transforms carbon monoxide to carbon dioxide, nitric oxide to nitrogen and oxygen, and unburned hydrocarbons to carbon dioxide and water by reaction with oxygen. Platinum, palladium, and rhodium catalysts permit these reactions to occur in less than a second. One of the reactions that takes place in the catalytic converter is the decomposition of nitrogen (II) oxide (NO) to nitrogen and oxygen gas. Smoot, Smith, Price, Chemistry A Modern Course, 1990, page 454
 oxide (NO) to nitrogen and oxygen gas. Smoot, Smith, Price, Chemistry A Modern Course, 1990, page 454.")
125
Catalytic Converter 2 CO(g) + 2 NO(g) N2(g) + 2 CO2(g) catalyst O N C
The platinum-rhodium catalyst provides a surface on which NO decomposes. The catalyst surface is large because it coats the surface of a honeycomb structure seen in the cutaway view of a catalytic converter. Catalytic converters are required on all new cars manufactured in the United States. A converter transforms carbon monoxide to carbon dioxide, nitric oxide to nitrogen and oxygen, and unburned hydrocarbons to carbon dioxide and water by reaction with oxygen. Platinum, palladium, and rhodium catalysts permit these reactions to occur in less than a second. N C O O One of the reactions that takes place in the catalytic converter is the decomposition of carbon monoxide (CO) to carbon dioxide and nitrogen (II) oxide (NO) to nitrogen gas.
 to carbon dioxide and nitrogen (II) oxide (NO) to nitrogen gas.")
126
Enthalpy Diagram H2(g) + ½ O2(g) H2O(g) H2O(l) Energy
DH = +242 kJ Endothermic -242 kJ Exothermic -286 kJ Endothermic DH = -286 kJ Exothermic H2O(g) Energy 44 kJ Exothermic +44 kJ Endothermic H2O(l) H2(g) + 1/2O2(g) H2O(g) kJ DH = kJ Kotz, Purcell, Chemistry & Chemical Reactivity 1991, page 211
 Energy. 44 kJ. Exothermic. +44 kJ. Endothermic. H2O(l) H2(g) + 1/2O2(g) H2O(g) kJ DH = -242 kJ. Kotz, Purcell, Chemistry & Chemical Reactivity 1991, page 211.")
127
Hess’s Law Calculate the enthalpy of formation of carbon dioxide from its elements. C(g) + 2O(g) CO2(g) Use the following data: 2O(g) O2(g) DH = kJ C(s) C(g) DH = kJ CO2(g) C(s) + O2(g) DH = kJ 2O(g) O2(g) DH = kJ C(g) C(s) DH = kJ C(s) + O2(g) CO2(g) DH = kJ C(g) + 2O(g) CO2(g) DH = kJ Smith, Smoot, Himes, pg 141
 O2(g) DH = kJ. C(s) C(g) DH = +720 kJ. CO2(g) C(s) + O2(g) DH = +390 kJ. 2O(g) O2(g) DH = kJ. C(g) C(s) DH = kJ. C(s) + O2(g) CO2(g) DH = kJ. C(g) + 2O(g) CO2(g) DH = kJ. Smith, Smoot, Himes, pg 141.")
128
CRANKCASE VENTILATION
The problem of crankcase ventilation has existed since the beginning of the automobile because no piston ring, new or old, can provide a perfect seal between the piston and the cylinder wall. Positive crankcase ventilation (PCV) systems were developed to ventilate the crankcase an recirculate the vapors to the engine’s induction system so they can be burned in the cylinders
 systems were developed to ventilate the crankcase an recirculate the vapors to the engine’s induction system so they can be burned in the cylinders.")
130
PCV VALVES

Similar presentations


 Chapter 12 Page 147-168. NO x emissions include: Nitric oxide, NO, and Nitrogen dioxide, NO 2, are normally categorized as NO.>")
 van Leeuwen.>")


 2.Carbon monoxides.>")


 burn, they release water vapor and carbon dioxide.>")


. Can be “good” up.>")

