Download presentation
Presentation is loading. Please wait.

1
National Weather Service Portland Near Shore Wave Forecasting William R. Schneider Science and Operations Officer Ron Beitel Information Technology Officer National Weather Service Portland, Oregon March 2009

2
Overview Motivation to Improve Wave Forecasts History of Bar Forecasts Portland Wave Modeling System Changes to Wave Forecast Products

3
Motivation To Improve Near Shore Wave Forecasts Most marine customers are in the Surf Zone or within 10 miles of coastline Very Hazardous River Bars in Oregon and Washington Columbia River has Significant Shipping, Commercial and Recreational Fishing Tillamook Bar Especially Deadly in the past 5 years (15 Fatalities) Waves are single greatest source of fatalities for weather phenomena in our forecast area
 Waves are single greatest source of fatalities for weather phenomena in our forecast area")
4
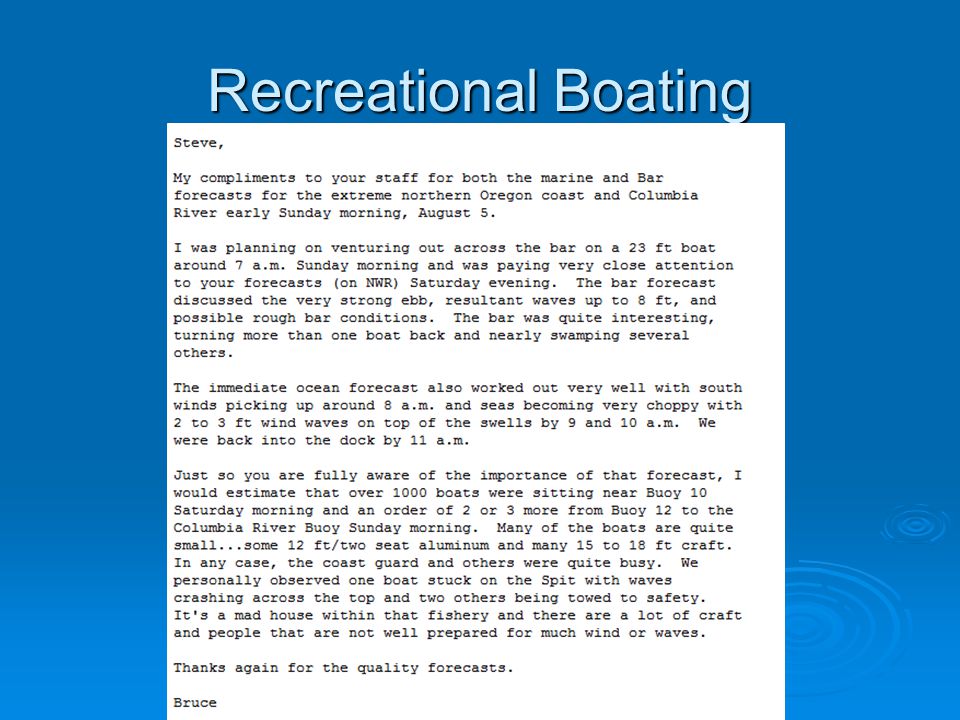
Recreational Boating

6
CDC Report - Commercial Fishing Fatalities 2000-2006 Oregon 21 [36%] California 20 [34%] Washington 17 [29%] Factors - Weather - 34 deaths (79%) Large Waves -17 deaths (40%)
![CDC Report - Commercial Fishing Fatalities Oregon 21 [36%] California 20 [34%] Washington 17 [29%] Factors - Weather - 34 deaths (79%) Large Waves -17 deaths (40%)](http://images.slideplayer.com/13/3919378/slides/slide_6.jpg "CDC Report - Commercial Fishing Fatalities Oregon 21 [36%] California 20 [34%] Washington 17 [29%] Factors - Weather - 34 deaths (79%) Large Waves -17 deaths (40%)")
7
Surf Zone Fatalities Source: Surf Zone Fatalities Source: Oregon Parks and Recreation 43 Fatalities 1990-2004 (14 years) 41Fatalities in the 8 years prior to 2004 That’s ~ 5 deaths/year Average
 41Fatalities in the 8 years prior to 2004 That’s ~ 5 deaths/year Average")
8
The Columbia River Entrance

9
Outbound on Rough Columbia River Bar

10
Boat in Distress on Bar

11
Limitations of NWS Legacy Wave Model Guidance Present day and Legacy WWIII not designed for shallow water waves Grid Spacing Was Reduced to 7km in 2008 but - Input winds can from GFS can be Inaccurate near shore Input winds can from GFS can be Inaccurate near shore Trough of waves can be below the bottom! Trough of waves can be below the bottom! Doesn’t resolve surf Doesn’t resolve surf Doesn’t predict runup or setup for coastal flooding Doesn’t predict runup or setup for coastal flooding Doesn’t resolve complex opposing current and wave to wave interactions (Bar Conditions) Doesn’t resolve complex opposing current and wave to wave interactions (Bar Conditions)
 Doesn’t resolve complex opposing current and wave to wave interactions (Bar Conditions).")
12
Columbia River and Grays Harbor Bar Forecasts Forecast of Waves at Columbia River Entrance Began 1977 Method used computer program or decay from outer buoys to forecast deepwater waves Method used computer program or decay from outer buoys to forecast deepwater waves Nomograms to forecast significant wave heights on the bar Nomograms to forecast significant wave heights on the bar Current System used to forecast waves at the Columbia River Bar and Grays Harbor Bar began in 1984 Simple one-dimensional computer model run on a PC Simple one-dimensional computer model run on a PC Model based on work at NOAA PMEL Model based on work at NOAA PMEL “A Case Study of Wave-Current-Bathymetry Interactions at the Columbia River Entrance” F.I Gonzalez Journal of Physical Oceanography Vol 14, No. 6, June 1984 “A Case Study of Wave-Current-Bathymetry Interactions at the Columbia River Entrance” F.I Gonzalez Journal of Physical Oceanography Vol 14, No. 6, June 1984 Forecaster enters starting and ending values of swell and wind wave, height, period, direction Forecaster enters starting and ending values of swell and wind wave, height, period, direction Simple statistical model developed by Elson/Schneider (NWS Portland) has been show to be more accurate than the current system Simple statistical model developed by Elson/Schneider (NWS Portland) has been show to be more accurate than the current system
 has been show to be more accurate than the current system Simple statistical model developed by Elson/Schneider (NWS Portland) has been show to be more accurate than the current system.")
13
Bar Forecast Model Output

14
Columbia River Bar Forecast

15
Near Shore Wave Modeling Project Background

16
Background Effort Began around 2002 WFO EKA Using SWAN Model Better Wave Forecasts in the Thermal Trough Better Wave Forecasts in the Thermal Trough Detailed Forecast for the Humboldt Bar Detailed Forecast for the Humboldt Bar Troy Nicollni, Eve Devaliere, Dave Nordello Troy Nicollni, Eve Devaliere, Dave Nordello NOAA Coastal Storms Initiative – 2004 Columbia River Study Area Columbia River Study Area Use Eureka’s Work and Extend to Columbia River Bar Use Eureka’s Work and Extend to Columbia River Bar

17
Background NOAA NWS Contracted Navel Research Labs Eric Rogers Eric Rogers Develop Prototype Develop Prototype Implement Eureka Code in Portland Implement Eureka Code in Portland Good Start But - NRL Prototype not designed for NWS systems and software NRL Prototype not designed for NWS systems and software Eureka Code Poorly Structured and Documented Eureka Code Poorly Structured and Documented Difficult to Set Up and Not Very Portable to Other NWS Offices or Configurations Difficult to Set Up and Not Very Portable to Other NWS Offices or Configurations Numerous Errors in Early Versions Numerous Errors in Early Versions Eureka Code Would Not Run In Portland Eureka Code Would Not Run In Portland Funding Ran Out Funding Ran Out

18
Work Done Since Eureka Focus on Coastal Waters Various Grants and Funding for Students Improve and develop code Implement Local Circulation Model for Humboldt Bar Partition Wave Information Implement at All WR Costal WFOs Portland Focus on Bar Forecasts Complete Redesign of Modeling System Rewrite Input Scripts Redesign Model Configuration Scripts Make Modeling System Portable Rewrite Output Scripts Limited Resources

19
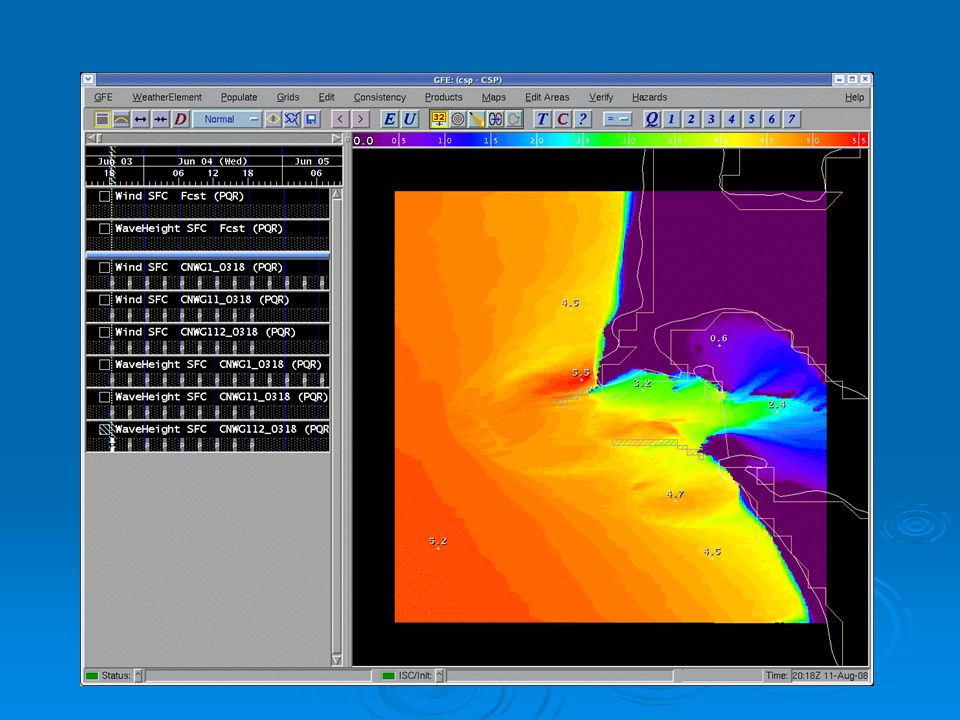
NWS Portland Wave Modeling System Real Time Forecast System Base Model is SWAN Run 4 Times per day Nearshore Waves All of Washington and Oregon Coastal Waters Concentrate on Bar Forecast 1. Columbia River – Very Complex 2. Tillamook 3. Gray’s Harbor 4. Others Six Nests 1. Large Outer Nest 2. Coastal Waters Nest 3. Gray’s Harbor Bar Nest 4. Columbia River Bar Nest 5. Tillamook Intermediate Nest 6. Tillamook River Bar Nest Bar Forecasts out 48 hours Develop System Easy to Set up at any NWS Office

20
Wave Modeling System Inputs NWS Graphical Forecast Editor winds Merged from Seattle, Portland and Medford NWS Offices Merged from Seattle, Portland and Medford NWS Offices Bathymetery – currently 3 arc sec data (90m) WWIII spectrum at the boundary Water Level from SELFE (not yet implemented) Tidal Current from SELFE (not yet implemented) SELFE Input provided by Center for Coastal Margin Observation and Prediction (CMOP) OHSU SELFE to be run at NCEP in the Future
 WWIII spectrum at the boundary Water Level from SELFE (not yet implemented) Tidal Current from SELFE (not yet implemented) SELFE Input provided by Center for Coastal Margin Observation and Prediction (CMOP) OHSU SELFE to be run at NCEP in the Future")
21
Forecaster Wind Input

22
Short Term Goals Obtain Tidal Current and Water Level Input from CMOP Test Runs and Simple Validation Web Interface to Display Output Port System to Cluster

23
Long Term Goals Tidal Current and Water Level Input from NOS/NCEP Explore High Performance Computing and Communications (HPCC) Grant http://www.pmel.noaa.gov/cnsd/hpcc-nwg/ Coupled Model with SELFE at CMOP and/or NOS/NCEP Bathymetery Update System Valdiation Observations from USCG Observations from USCG Observations from Columbia River Bar Pilots Observations from Columbia River Bar Pilots
 Grant Coupled Model with SELFE at CMOP and/or NOS/NCEP Bathymetery Update System Valdiation Observations from USCG Observations from USCG Observations from Columbia River Bar Pilots Observations from Columbia River Bar Pilots")
24
Challenges No Current Funding from NWS or NOAA All work being done (or not done) by Ron and Bill as time available
 by Ron and Bill as time available")
25
Output for Customers New Graphical Web Based Products For Bars Significant Wave Height Significant Wave Height Mean Wave Direction Mean Wave Direction Steepness – Probability of Breakers Steepness – Probability of Breakers Wave Hazard Wave Hazard Tidal Current Tidal Current Enhanced Text in Coastal Waters Forecast Bar Forecast

Similar presentations


 Demonstration Project Ports of Los Angeles/Long Beach Julie Thomas Southern California Coastal Ocean Observing.>")


 is responsible for forecasts several times.>")


