Download presentation
Presentation is loading. Please wait.

1
Modeling the Asymmetry of Stock Movements Using Price Ranges Ray Y. Chou Academia Sinica “ The 2002 NTU International Finance Conference” Taipei. May 24-25, 2002

2
Motivation Provide separate dynamic models for the upward- range and the downward-range to allow for asymmetries. Factors driving the upward movements and the downward movements maybe different. Upward range applications: market rallies, call options, historical new highs, limit order to sell Downward range applications: Value-at-Risk, put options, limit order to buy

3
Main Results ACARR is similar to CARR and ACD but with a different limiting distribution and with new interpretations and implications. Properties: QMLE, Distribution Empirical results using daily S&P500 index show asymmetry in dynamics, leverage effect, periodic patterns and interactions of upward and downward movements. Volatility forecast accuracy: ACARR>CARR>GARCH

4
Range as a measure of the “realized volatility” Simpler and more natural than the sum-squared- returns (measuring the integrated volatility) of Anderson et.al.(2000) Parkinson (1980) and others have established the efficiency gain of range over standard method in estimating volatilities Chou (2001) proposed CARR, a dynamic model for range with satisfactory performance
 of Anderson et.al.(2000) Parkinson (1980) and others have established the efficiency gain of range over standard method in estimating volatilities Chou (2001) proposed CARR, a dynamic model for range with satisfactory performance")
5
Discrete sampling from a continuous process

6
Upward range and downward range

7
Range and one-sided ranges

8
The Conditional Autoregressive Range Expectation (CARR) model in Chou (2001)
 model in Chou (2001)")
9
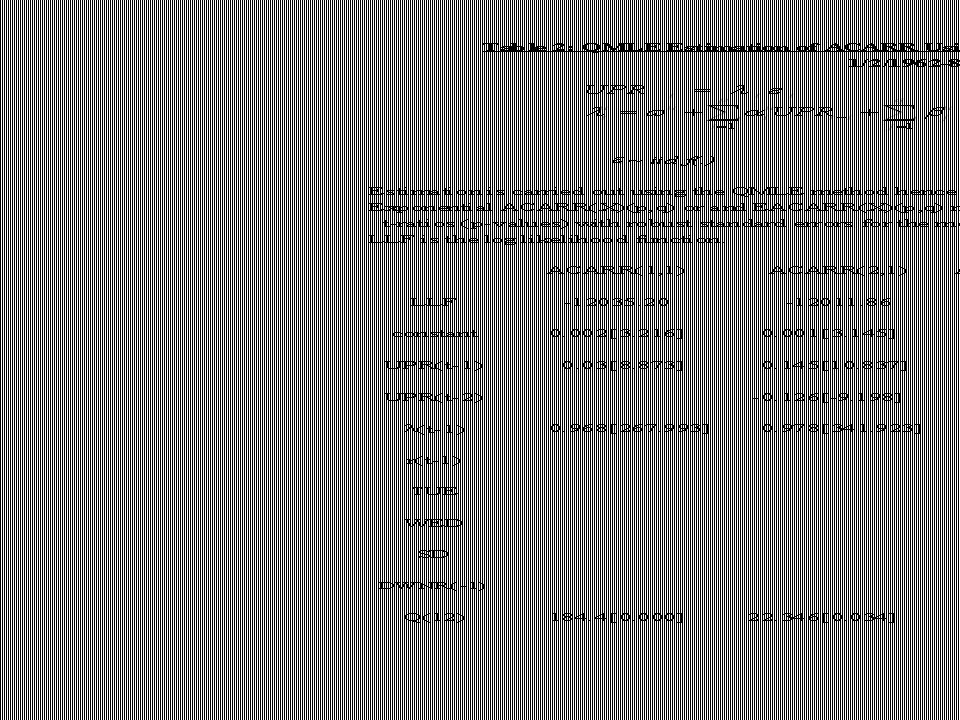
The Asymmetric Conditional Autoregressive Range Expectation -ACARR(p,q) model
 model")
10
Distribution assumptions in ACARR

11
ACARRX(p,q) – ACARR(p,q) with exogenous variables
 – ACARR(p,q) with exogenous variables")
12
Explanatory variables in the ACARRX(p,q) model Lagged returns – leverage effect Periodic (weekday) pattern Transaction volumes Interaction tems – lagged DWNR in expected UPR and lagged UPR in expected DWNR
 model Lagged returns – leverage effect Periodic (weekday) pattern Transaction volumes Interaction tems – lagged DWNR in expected UPR and lagged UPR in expected DWNR")
13
Properties of ACARR Same as ACD of Engle and Russell (1998) but with a known limiting distribution for the error term A conditional mean model An asymmetric model for volatilities
 but with a known limiting distribution for the error term A conditional mean model An asymmetric model for volatilities")
14
Sources of asymmetry for an ACARRX(1,1) model – short term shock impact – long term persistence of shocks – speed of mean-reverting ‘s – effects of leverage, periodic pattern, interaction terms, among others
 model – short term shock impact – long term persistence of shocks – speed of mean-reverting ‘s – effects of leverage, periodic pattern, interaction terms, among others")
15
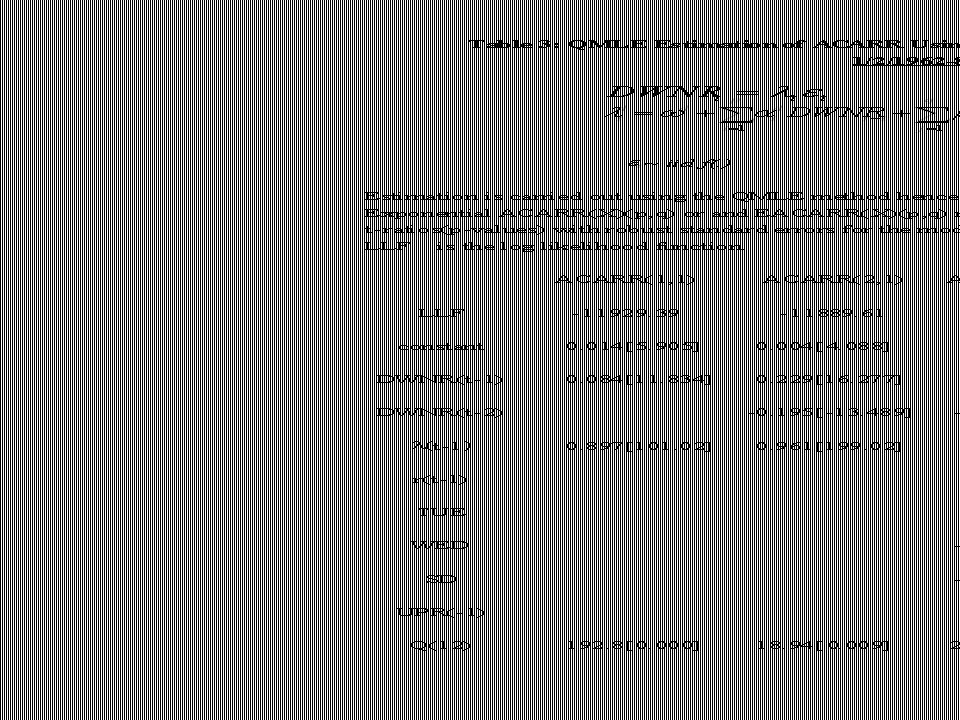
A special case of ACARR: Exponential ACARR(1,1) or EACARR(1,1) It’s useful to consider the exponential case for f(.), the distribution of the normalized range or the disturbance. Like GARCH models, a simple (p=1, q=1) specification works for many empirical examples.
 specification works for many empirical examples..")
16
ACARR vs. ACD identical formula ACARR Range data, positive valued, with fixed sample interval QMLE with EACARR Known limiting distribution A new volatility model ACD Duration data, positive valued, with non-fixed sample interval QMLE with EACD Unknown limiting distribution Hazard rate interpretation

17
The QMLE property Assuming any general density function f(.) for the disturbance term t, the parameters in ACARR can be estimated consistently by estimating an exponential-ACARR model. Proof: see Engle and Russell (1998), p.1135
, p")
18
The QMLE Estimation Consistent standard errors are obtained by employing the robust covariance method in Bollerslev and Wooldridge (1987). See Engle and Russell (1998).
..")
19
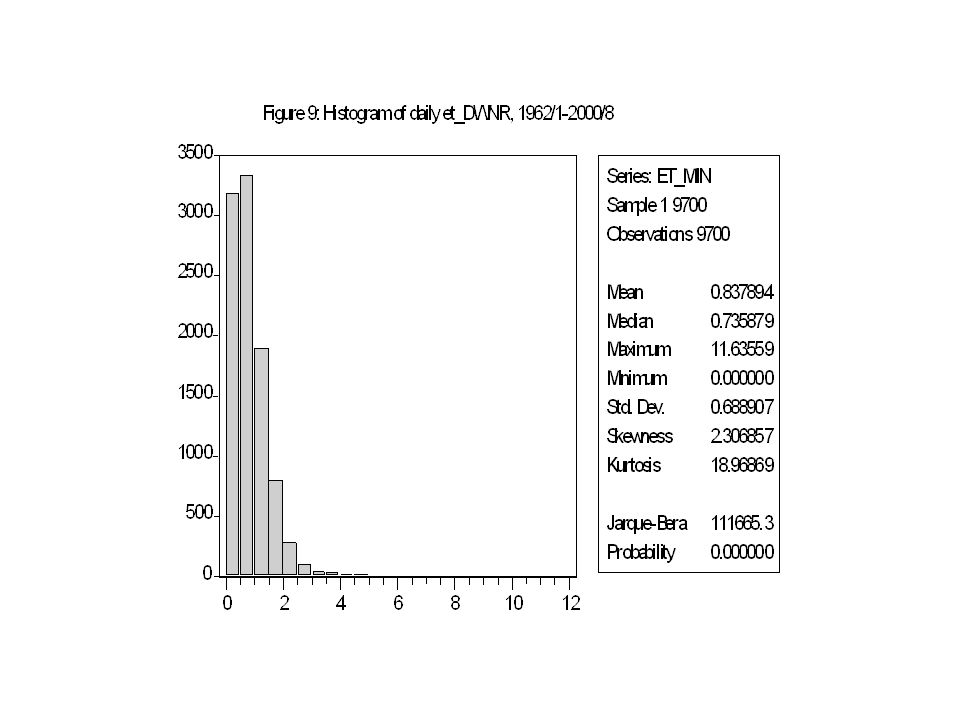
Empirical example: S&P500 daily index Sample period: 1962/01/03 – 2000/08/25 Data source: Yahoo.com Models used: EACARR(1,1), EACARRX(p,q) Both daily and weekly observations are used for estimation Forecast comparison of CARR and ACARR
, EACARRX(p,q) Both daily and weekly observations are used for estimation Forecast comparison of CARR and ACARR")
33
Figure 11: Q-Q plot of et-DWNR

35
Extensions Robust ACARR – Interquartile range Multivariate ACARR Nonparametric or semiparametric ACARR Other data sets and simulations Long memory ACARR’s – IACARR, FIACARR,… ACARR and option price models

36
Conclusion ACARR is effective in modeling upward and downward market movements. Asymmetry found: dynamics, leverage effect, periodic patterns, interaction terms CARR provides more accurate volatility forecasts than GARCH (Chou (2001)) and ACARR gives further improvements.
) and ACARR gives further improvements..")
Similar presentations


>")


) ●Zero intelligence.>")


 Department of Statistics UNIVERSIDAD CARLOS III DE MADRID.>")


