Download presentation
Presentation is loading. Please wait.

1
Assignments 2.1-2.4 Due Wednesday 12, 2014 Assignments 2.5-2.6 Due Friday 14, 2014

2
Sta220 - Statistics Mr. Smith Room 310 Class #5

3
Section 2.6-2.7

4
Revisit 2.6

5
Sanitation Inspection of Cruise Ships

7
a. Find the mean and standard deviation of the sanitation scores.

8
Sanitation Inspection of Cruise Ships

9
c. Find the percentage of measurement in the data set that fall within each of the intervals in part b. Do these percentages agree with either Chevyshev’s rule or the empirical rule?

11
Land Purchase Decision On the basis of this information, what is the buyer’s decision?

12
1-12 Lesson Objectives You will be able to: 1.Interpret percentiles(2.7) 2.Determine and interpret quartiles (2.7) 3.Determine and interpret z-scores (2.7)
 2.Determine and interpret quartiles (2.7) 3.Determine and interpret z-scores (2.7)")
13
Lesson Objective #1-Interpret percentiles(2.7)
")
14
Central tendency and variability describe the general nature of quantitative data.

15
Descriptive measures of the relationship of measurement to the rest of the data are called measures of relative standing. One measure of the relative standing of measurement is its percentile ranking.

17
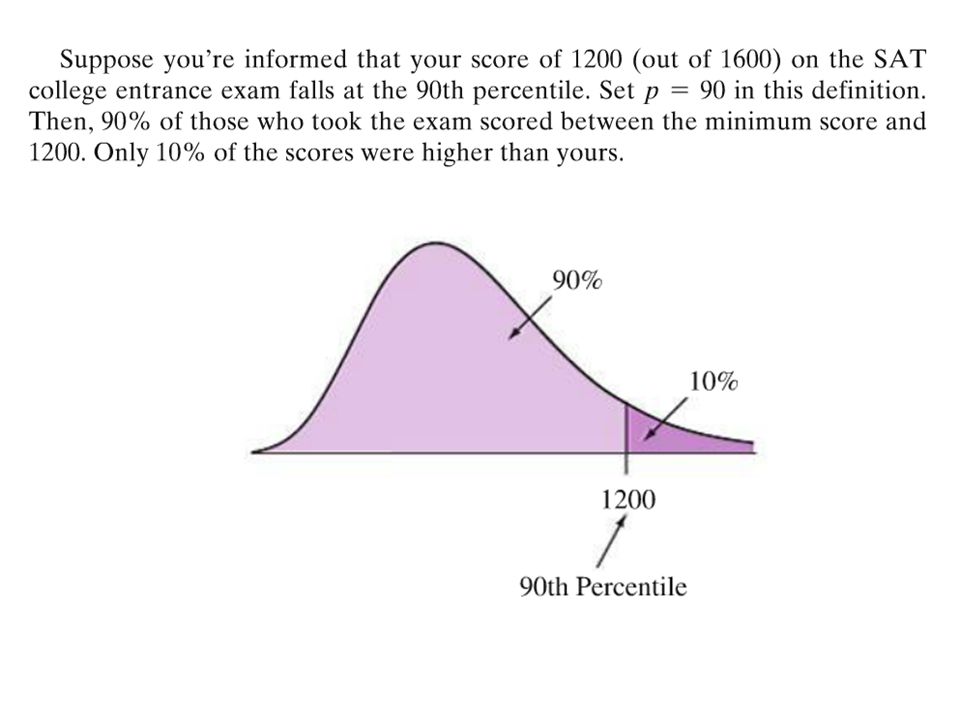
The pth percentile is a value such that p percent of the observations fall below or at that value.

19
Copyright © 2013 Pearson Education, Inc.. All rights reserved. Location of 90 th percentile for test grades

20
EXAMPLE Interpret a Percentile The Graduate Record Examination (GRE) is a test required for admission to many U.S. graduate schools. The University of Pittsburgh Graduate School of Public Health requires a GRE score no less than the 70th percentile for admission into their Human Genetics MPH or MS program. (Source: http://www.publichealth.pitt.edu/interior.php?pageID=101.) Interpret this admissions requirement. 3-20
 Interpret this admissions requirement")
21
EXAMPLE Interpret a Percentile In general, the 70 th percentile is the score such that 70% of the individuals who took the exam scored worse, and 30% of the individuals scores better. In order to be admitted to this program, an applicant must score as high or higher than 70% of the people who take the GRE. Put another way, the individual’s score must be in the top 30%. 3-21

22
Lesson Objective #2 Determine and interpret quartiles (2.7)
")
23
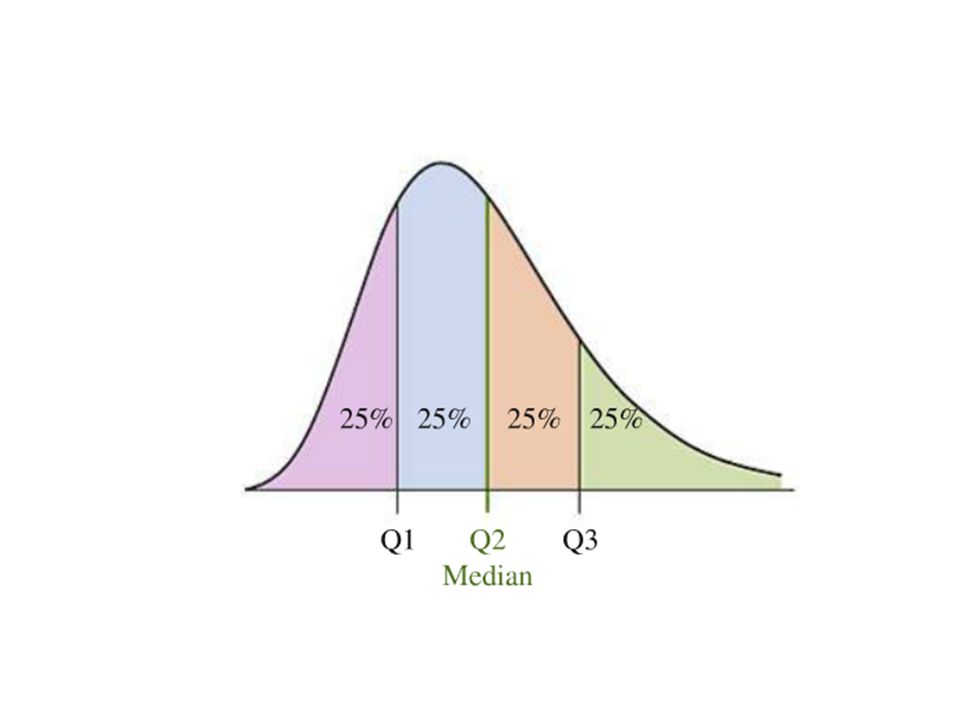
Quartiles divide data sets into fourths, or four equal parts. The 1 st quartile, denoted Q 1, divides the bottom 25% the data from the top 75%. Therefore, the 1 st quartile is equivalent to the 25 th percentile. The 2 nd quartile divides the bottom 50% of the data from the top 50% of the data, so that the 2 nd quartile is equivalent to the 50 th percentile, which is equivalent to the median. The 3 rd quartile, denoted Q 3, divides the bottom 75% of the data from the top 25% of the data, so that the 3 rd quartile is equivalent to the 75 th percentile.

24
3-24

26
A group of Brigham Young University—Idaho students (Matthew Herring, Nathan Spencer, Mark Walker, and Mark Steiner) collected data on the speed of vehicles traveling through a construction zone on a state highway, where the posted speed was 25 mph. The recorded speed of 14 randomly selected vehicles is given below: 20, 24, 27, 28, 29, 30, 32, 33, 34, 36, 38, 39, 40, 40 Find and interpret the quartiles for speed in the construction zone. EXAMPLE Finding and Interpreting Quartiles 3-26

27
EXAMPLE Finding and Interpreting Quartiles Step 1: The data is already in ascending order. Step 2: There are n = 14 observations, so the median, or second quartile, Q 2, is the mean of the 7 th and 8 th observations. Therefore, M = 32.5. Step 3: The median of the bottom half of the data is the first quartile, Q 1. 20, 24, 27, 28, 29, 30, 32 The median of these seven observations is 28. Therefore, Q 1 = 28. The median of the top half of the data is the third quartile, Q 3. Therefore, Q 3 = 38. 3-27

28
Interpretation: 25% of the speeds are less than or equal to the first quartile, 28 miles per hour, and 75% of the speeds are greater than 28 miles per hour. 50% of the speeds are less than or equal to the second quartile, 32.5 miles per hour, and 50% of the speeds are greater than 32.5 miles per hour. 75% of the speeds are less than or equal to the third quartile, 38 miles per hour, and 25% of the speeds are greater than 38 miles per hour. 3-28

29
Sodium in Cereal

31
05070100130140 150160180 190200 210 220290340

32
Lesson Objective #3 Determine and interpret z- scores (2.7)
")
33
Z-Scores

36
Interpretation of z-Scores from Mound-Shaped Distributions of Data Approximately 68% of the measurements will have a z-score between -1 and 1 Approximately 95% of the measurements will have a z-score between -2 and 2. Approximately 99.7% (almost all) of the measurements will have a z-score between -3 and 3.
 of the measurements will have a z-score between -3 and 3..")
37
Copyright © 2013 Pearson Education, Inc.. All rights reserved. Figure 2.30 Population z-scores for a mound– shaped distribution

38
Example: z-Score

39
Copyright © 2013 Pearson Education, Inc.. All rights reserved. Figure 2.29 Verbal SAT scores of high school seniors This tells us that Joe Smith’s score is 1.0 standard deviations below the sample mean; in short, his sample z-score is -1.0

40
EXAMPLE Using Z-Scores The mean height of males 20 years or older is 69.1 inches with a standard deviation of 2.8 inches. The mean height of females 20 years or older is 63.7 inches with a standard deviation of 2.7 inches. Data based on information obtained from National Health and Examination Survey. 3-40

41
EXAMPLE Using Z-Scores Shaquille O'Neal’s height is 7’1’’. Candace Parker’s height is 6’4’’. Who is relatively taller? 3-41 http://en.wikipedia.org/wiki/Shaquille_O'Nealhttp://www.wnba.com/news/rookieofmonth_080603.html

42
EXAMPLE Using Z-Scores Shaquille O'Neal’s height is 7’1’’ thus his z-score is Candace Parker’s height is 6’4’’ which produces a z-score of O’Neal is relatively taller as he has a larger z-score. 3-42

Similar presentations