Download presentation
Presentation is loading. Please wait.

1
CBE 555 Presentation October 2011 Robbie Erickson

2
Historical Basis Process Background Present issues Natural Product Biological perspective Process perspective Nutritional Implications Political-Economic Standing

3
Corn aka Maize New World crop from Mezo-America Extremely efficient biomass yield Corn Flour o Almost entire use through 19 th century o Limited palatability o Associated with poor/rural and Pellegra Wet corn milling c. 1900 o Starch and glucose production o HFCS- 1970’s Alternative to HFCS: Refined Sugars Sugar Cane and Sugar beets Popularized 17 th centuries onwards

4
Common Uses: Cattle Feed Fuel Ethanol Other o Corn Oil o Food Starch o Corn Flour o Seed o Specialty Chemicals o Corn Syrup (~5% of total) Chart Source: ncga.com
 Chart Source: ncga.com")
6
Image Source: Corn Refiners Association

7
Image Source: TateandLyle.com

8
Most Common Types: HFCS 55 Soft Drinks Approximately same sweetness as sucrose 55 % fructose 42 % glucose HFCS 42 Baked Goods, other foods Less sweet than sucrose 42% Fructose, 53% Glucose HFCS 90 (least common) Specialty confections, blending with HFCS 42 90% Fructose, 10% Glucose
 Specialty confections, blending with HFCS 42 90% Fructose, 10% Glucose")
9
No FDA standard definition Objections if: o Added Colors o Artificial Flavors o Synthetic Substances Statement: HFCS is not “Natural” Vs. Sugar Cane and Sugar beets Popularized 17 th centuries onwards FDA has ruled HFCS cannot be significant ingredient in “Natural Products” Due to modification of enzymes

10
Extensive Sodium Hydroxide used in-process Formerly sourced from mercury cells (still is overseas)
")
11
Glycolysis and other pathways Glycoside Hydrolase (or other enzymes)
")
12
BeverageCalories per 20 oz Mountain Dew290 Throwback Mountain Dew280 Pepsi250 Throwback Pepsi260 Source:pepsi.com

13
J Diabetes Sci Technol. 2010 July; 4(4): 1008–1011. (NIH funded) “The fructose hypothesis is based largely on epidemiologic data that do not establish cause and effect.” “Fructose consumption has also been related to the metabolic syndrome and to abnormal lipid patterns. This evidence suggests that we should worry about our current level of fructose consumption, which has been increasing steadily for over 200 years and now represents over 10% of the energy intake of some people.” -International Journal of Obesity 32, S127-S131 (December 2008)
 The fructose hypothesis is based largely on epidemiologic data that do not establish cause and effect. Fructose consumption has also been related to the metabolic syndrome and to abnormal lipid patterns. This evidence suggests that we should worry about our current level of fructose consumption, which has been increasing steadily for over 200 years and now represents over 10% of the energy intake of some people. -International Journal of Obesity 32, S127-S131 (December 2008).")
15
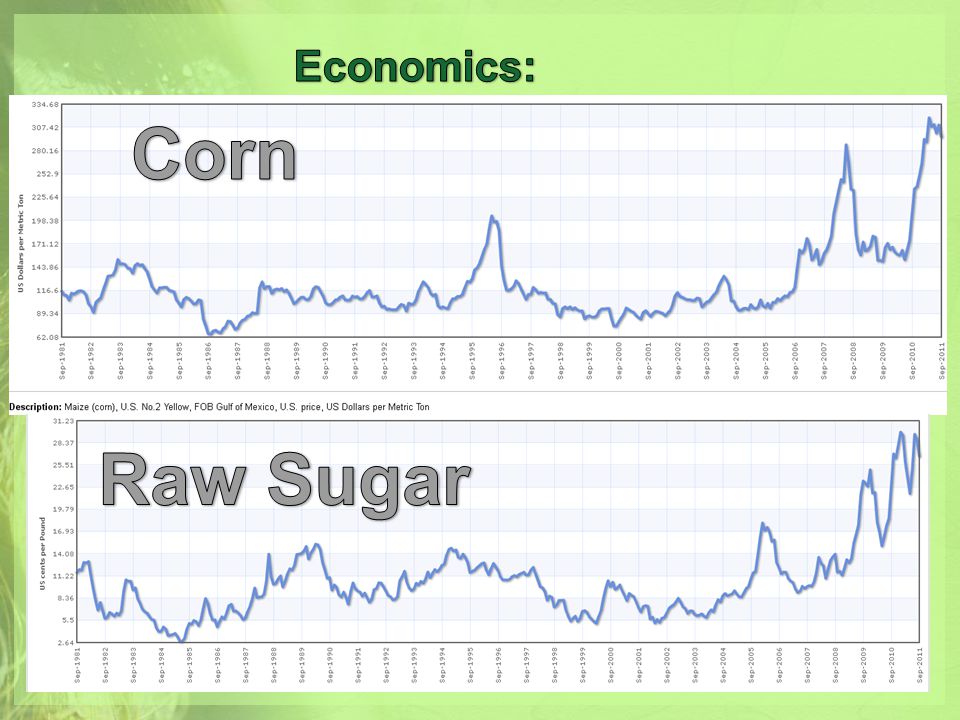
-~1000 oz HFCS /bushel corn -Corn $6/bushel (2011 pricing) -~15 oz/2 L soda -~10 of raw corn in a 2L -(in 2005, ~3.8 raw materials = ~12 refined) VS. -Assume approx. same weight sugar, ~30/lb) -28/ 2L soda in 2005
 -28/ 2L soda in")
18
Questions? Key Points: Natural vs. Artificial Nutritional Value Economic Impact

19
From USDA.gov A 2-liter bottle of soda contains about 15 ounces of corn in the form of high-fructose corn syrup. At $3.40 per bushel, the actual value of corn represented is 5.7 cents, compared with 3.8 cents when corn is priced at $2.28 per bushel. Assuming no other cost increases, the higher corn price in 2007 would be expected to raise soda prices by 1.9 cents per 2-liter bottle, or 1 percent. These are notable changes in terms of price measurement and inflation, but relatively minor changes in the average household food budget. (USDA.gov)
.")
20
USDA.gov HFCS’s lower cost is one of the main reasons for its substitution for sucrose. Industry analysts report that, on a sweetness equivalent/dry basis, HFCS-42 (one of the blends of HFCS) cost an average of 13.6 cents per pound in 2005, while the price of wholesale refined beet sugar averaged 29.5 cents per pound. Also, because HFCS is a liquid, it is easier to blend into many foods than sugar. HFCS is commonly used to sweeten soft drinks, sport drinks, and numerous processed foods, such as ketchup, crackers, bread, soups, cereals, and spaghetti sauce.
 cost an average of 13.6 cents per pound in 2005, while the price of wholesale refined beet sugar averaged 29.5 cents per pound. Also, because HFCS is a liquid, it is easier to blend into many foods than sugar. HFCS is commonly used to sweeten soft drinks, sport drinks, and numerous processed foods, such as ketchup, crackers, bread, soups, cereals, and spaghetti sauce..")
Similar presentations


? Why do food manufacturers use it? Which food products.>")


.The Sugar Awareness & Elimination.>")


