Download presentation
Presentation is loading. Please wait.

1
Energy and the Environment Second Edition Chapter 2: The Fossil Fuels Copyright © 2006 by John Wiley & Sons, Inc. Robert A. Ristinen Jack J. Kraushaar

2
The Fossil Fuels 84 QBtu of the total 98 QBtu (86%) of energy used in the U.S. every year are from fossil fuels. Coal, natural gas, petroleum, and to lesser extents shale oil and tar sands make up the fossil fuels. Formed millions to hundreds of million years ago and are considered nonrenewable sources of energy on human time scales.

3
Petroleum

4
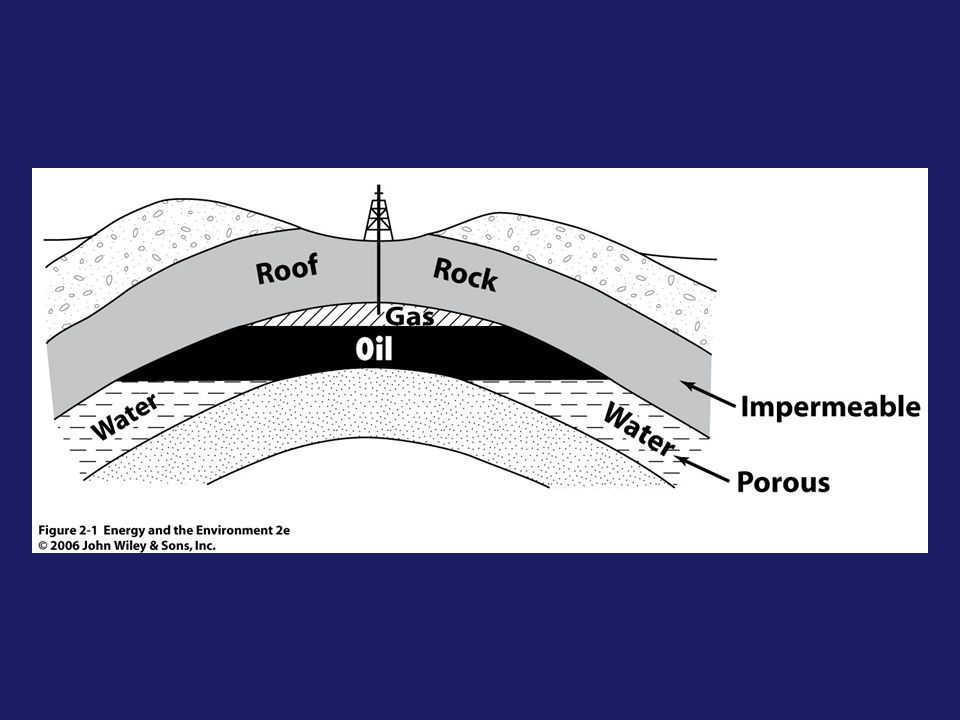
Definition of petroleum includes liquid crude oil, and natural gas liquids as well as the common fuels propane and butane. Came to the Earth hundreds of millions of years ago as radiant energy from the sun. Radiant energy was captured by plant life through photosynthesis which fixes carbon into carbohydrates and stores the solar energy as chemical energy. Animals then feed on this plant life. Petroleum comes from plant an animal life in the ancient seas of hundreds of millions of years ago. The buried liquid and gaseous hydrocarbons can travel large distances and get captured under geologic structures.

6
Petroleum Methods of locating petroleum have become more sophisticated over time and includes the use of exploration seismology. seismology The first well drilled is called an exploratory or wildcat well. About 1 out of every 9 wells are found for every wildcat. Once a petroleum well has been discovered, further drills are used to determine the extent of the well and the total amount of oil that can be extracted is estimated and added to the proved reserve.

7
History of the Production of Petroleum in the U.S. “Colonel” Drake started the whole thing in 1859 in Titusville, Pennsylvania when he drilled and found an oil reserve at 69 ft. depth. News spread quickly and by 1862, 3 million barrels of oil were produced from more than 75 wells in PA. Oil was also soon found in Ohio, Indiana, California, and Texas. By 1909, the U.S. was producing 500,000 barrels per day. The birth of the auto industry soon gave oil a new importance. Annual production rose steadily until 1970, when a peak of 3.3 x 10 9 barrels per year was reached.

9
History of the Production of Petroleum in the U.S. Since 1948, the U.S. has imported more oil each year than it has exported. We now import more than 50% of the oil we consume. Drilling for oil has been drastically reduced over the last 25 years due to costs. (6600 oil drills in 2004, compared to 44,000 in 1981. 1000 drilling rigs in operation in 2003, compared to 4,000 in 1981.) In North America, drilling costs have gone up from $5/bbl in 1999 to $11/bbl in 2004.
 In North America, drilling costs have gone up from $5/bbl in 1999 to $11/bbl in")
10
Petroleum Resources of the U.S. Q ∞ is the symbol used to define the total resource of oil that is available over all time from the beginning of the oil industry to the exhaustion of the resource. The concept of “economically recoverable” must be taken into consideration since there will always be some petroleum left underground (70%) that takes more energy or costs more to produce than it is worth. Typical delay of 11 years between discovery and production.
 that takes more energy or costs more to produce than it is worth. Typical delay of 11 years between discovery and production..")
12
Petroleum Resources of the U.S. In 1956, M.K. Hubbert, a petroleum geologist predicted a Q ∞ of 165 x 10 9 barrels of oil for the U.S. exclusive of Alaska. He also predicted a peak between the years of 1966 and 1971. He was right! Other studies have shown mean values of 20 x 10 9 barrels in proved reserves and a total of 113 x 10 9 barrels as the remaining U.S. resource. At current rates of consumption, petroleum will last another 20 years. Advances in secondary and tertiary recovery may increase our recoverable petroleum in the future.

13
World Production of Petroleum Total world production in 2003 was 68,561 x 10 3 bbl/day. The countries belonging to the Organization for Petroleum Exporting Countries (OPEC) accounts for 40% of the total. The Middle East is producing 500 times for petroleum than the U.S. In 1969, Hubbert predicted that world production would peak in 2000. Edwards (1993) predicted a peak between 2010 and 2020. There is growing evidence that peak production is very near.
 accounts for 40% of the total. The Middle East is producing 500 times for petroleum than the U.S. In 1969, Hubbert predicted that world production would peak in Edwards (1993) predicted a peak between 2010 and There is growing evidence that peak production is very near..")
14
The Cost of Gasoline in the U.S. The cost of gasoline in the U.S. is relatively cheap when we consider constant dollar rates. (Cost of gasoline in 1947 was $2.10 compared to $2.80 in 1980.) With the exception of Canada the cost of gasoline in most other industrialized countries is 2 or 3 times greater than the U.S. Competition has kept prices down. Our tax rates are also much lower. In 2002, we were levying a tax of $0.40 per gallon compared to $2.80 in other countries. Low tax rates can actually have a negative impact on environmental concerns from the burning of fossil fuels.
 With the exception of Canada the cost of gasoline in most other industrialized countries is 2 or 3 times greater than the U.S. Competition has kept prices down. Our tax rates are also much lower. In 2002, we were levying a tax of $0.40 per gallon compared to $2.80 in other countries. Low tax rates can actually have a negative impact on environmental concerns from the burning of fossil fuels..")
15
Petroleum RefiningRefining Crude petroleum taken from the ground is a mixture of hydrocarbons and some impurities such as sulfur and needs to be treated to generate useable energy. Fractional Distillation – crude oil is vaporized by heating it to 400 degrees Celsius. A fractionating tower then separates the products based on their condensation temperatures. Heavier products are broken apart through thermal cracking or through catalytic conversion. Joining together lighter hydrocarbons to make heavier ones is called polymerization.

17
Natural Gas Natural gas is principally methane 80% - 95%, and usually contains ethane. Natural gas has increased in popularity due to improvements in exploration methods, it has less harmful combustion products, and it is less costly. In September, 2004 the typical cost for heating a home was $12.83 compared to $26.08 for electricity. Automobiles are using more and more natural gas nowadays as well.

18
The History of the Use of Natural Gas Goes back to the sixth century B.C. in China and Japan where gas was transported to lighting fixtures through bamboo pipes. More widespread use began in Fredonia, NY in 1821 where pipes were used to provide gas for burners. Widespread use was held back due to a lack of proper pipelines. During WWII, pipelines began to be laid and its use increased dramatically. Only 17% of our natural gas is imported (mostly from Canada). Lower costs and decreased air pollution has seen natural gas grow in popularity of the past few decades.
. Lower costs and decreased air pollution has seen natural gas grow in popularity of the past few decades..")
20
Natural Gas Resource Base for the U.S. For the U.S., we have an estimate of about 8 years left of natural gas proved resources. Other estimates show approximately 30 years left but if consumption rates and population growth increase, that estimate is likely on the high end. Improvements in extracting coalbed methane over the past several years that may increase our supply.

21
Natural Gas Resource Base for the World Proved reserves in the U.S. makes up only 3% of the total worldwide. Natural gas hydrates has been relatively unexplored and can potentially contain twice the amount of carbon found in all the fossil fuels found on Earth.hydrates We currently lack a sufficient pipeline system for natural gas exports and imports. It is possible to transport natural gas as a liquid (LNG) but it is extremely dangerous due to its ease of combustion.
 but it is extremely dangerous due to its ease of combustion..")
22
Coal Coal has its origin as plant life that began to grow more than 350 million years ago in ancient bogs and swamps. From low-grade to high-grade coal: Peat, Lignite (up to 50% carbon), Bituminous (50 – 80%), and Anthracite (up to 95%). Largest deposits found in Wyoming, North and South Dakota, Montana, and New Mexico. Most of the western coals are subbituminous.
, Bituminous (50 – 80%), and Anthracite (up to 95%). Largest deposits found in Wyoming, North and South Dakota, Montana, and New Mexico. Most of the western coals are subbituminous..")
23
Coal Resources and Consumption Amount can be more easily determined based on the relatively shallow depth at which it is typically found. Anthracite is mainly in Pennsylvania, Bituminous in Illinois and West Virginia. Rocky Mt. region is mostly subbituminous. There is a vast amount of coal in the world with 25% in the U.S. Some concerns over pollution from the burning of coal has slowed its use. At current rates of consumption, coal will last the U.S. another 261 years. Centralia

25
Shale Oil The Green River Formation (Idaho, Colorado, Utah, and Wyoming) formed 50 million years ago and is the source of shale oil. The Green River Formation The oil shale or marlstone contains an organic substance called kerogen, a hydrocarbon that vaporizes when heated. These vapors can be condensed to form gasoline, fuel oil, and coke. The removal of the overburden is very expensive holding back its use. When heated the shale rock expands by 35% making it difficult to store the waste products.

27
Tar Sands Deposits of sand impregnated with a thick, tarlike hydrocarbon substance with a high viscosity called bitumen. Because of its high viscosity, it will not flow as a liquid. It must be mined as a solid material and transported to a processing plant where the bitumen is extracted by steam or hot water. The Athabascan deposit in Alberta, Canada has by far the largest deposits of tar sands in North America. It takes 2 tons of tar sand to produce 1 barrel of oil. Costs have gone down as extraction methods have improved and they may be a viable source of fuel in the future.

28
Summary The fossil fuels make up 86% of our total energy source in the U.S. Fossil fuels are nonrenewable and we are getting very close to depleting them entirely. The burning of fossil fuels also has a detrimental affect on the climate of the planet. Therefore, environmental considerations must be considered.

Similar presentations


>")


