Download presentation
Presentation is loading. Please wait.

1
英语写作专题 How to describe a graph

2
Warming up item200820092010 food45%39%27% clothes17%19%13% others38%42%60% tablepie chart line gragh

4
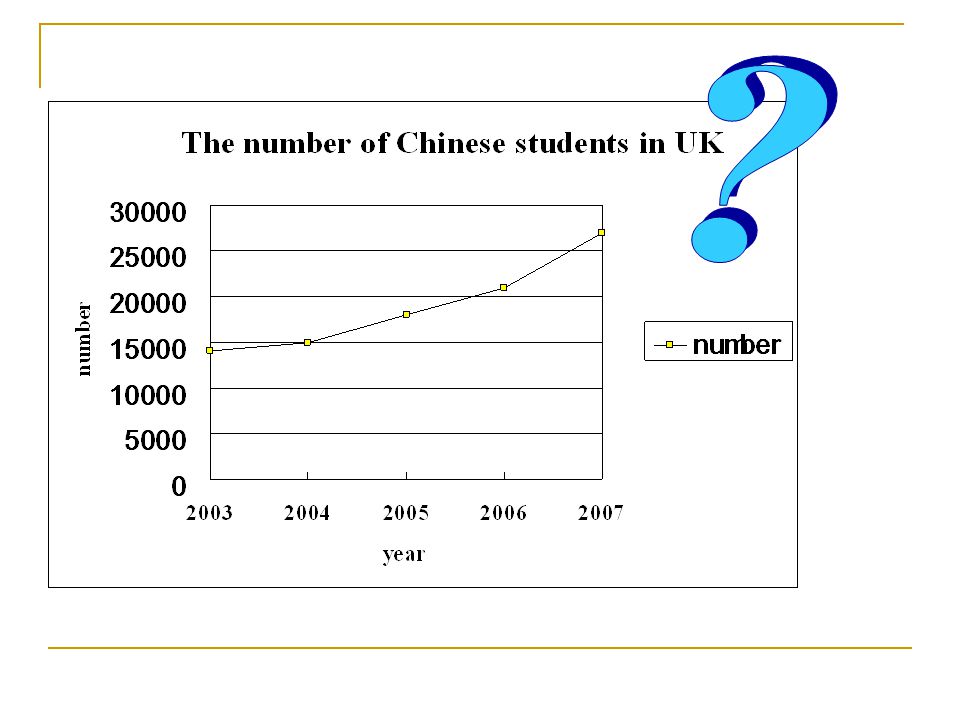
The graph ______ the number of Chinese students studying in UK. The number ______ _______14,000 in 2003 and then it __________ ______. _________ _____ the year before, it increased _____28%. Overall,it can be __________ ____ the graph that there was a steady increase in the number of the Chinese students in UK from 2003 to 2007. startedwith increasedsteadily with concluded Compared Filling the blanks shows by from

5
D. Two major reasons may account for the change. The Bristish education system is flexible. Besides, the quality of its course is guaranteed. Arrange them in order A. Overall, it can be concluded from the graph that there was a steady increase in the number of the Chinese students in UK from 2003 to 2007. B.The graph shows the number of Chinese students studying in UK during the past four year. C. The number started with 14,000 in 2003 and then it increased steadily until it reached its highest at 27,000 four years later.

6
D. Two major reasons may account for the change. The Bristish education system is flexible. Besides, the quality of its course is guaranteed. Arrange them in order A. Overall, it can be concluded from the graph that there was a steady increase in the number of the Chinese students in UK from 2003 to 2007. B.The graph shows the number of Chinese students studying in UK during the past four years. C. The number started with 14,000 in 2003 and then it increased steadily until it reached its highest at 27,000 four years later. Introduction Data details Reasons Conclusion

7
Learn to describe ____ (正如) is shown in the graph, … ____ (正如) can be seen from the table, … The introduction The graph _________________________________… The graph shows the number of Chinese students studying in UK during the past four year. Similar words or phrases Various structures ____________ (根据) the graph, … indicates/displays/describes/ As According to
 the graph, … indicates/displays/describes/ As According to.")
8
It's clear from the graph that..., We can draw the conclusion that..., The figures lead us to the conclusion that… Learn to describe The conclusion in a word, in short, to sum up, in conclusion Overall, it can be concluded from the graph that there was a steady increase in the number of the Chinese students in UK from 2003 to 2007.

9
Learn to describe The data detail The number started with 14,000 in 2003 and then it increased steadily until it reached its highest at 27,000 four years later. Compared with the year before, it increased by 28%. Hint One: There be…( 在这段时间内有一个稳定增长 ) _______________________________________________ Hint Two: rise (vi.) _______________________________________________ There was______________________________ within this period. The number rose _____ 14,000 in 2003 __ 27,000 in 2007. Hint Three: compared with… , it increased by Compared with the year before, it increased by 28%. a steady increase of the number fromto
 _______________________________________________ Hint Two: rise (vi.) _______________________________________________ There was______________________________ within this period. The number rose _____ 14,000 in 2003 __ 27,000 in Hint Three: compared with… , it increased by Compared with the year before, it increased by 28%. a steady increase of the number fromto.")
10
Learn to describe The possible reasons Moreover/ what is more/ in addition/ apart from this/ For one thing, for another Hint: Use transitional words and phrases to connect sentences Two major reasons may account for the change. The Bristish education system is flexible. Besides, the quality of its course is guaranteed. * The reason ___…is that * The change in …results ____ the fact that because…… why from

11
下表为某市 1998 年与 2008 年人们度假 方式的情况比较及其原因 年度 19982008 原因 境外旅游 ( traveling abroad ) 11%22% 收入增加 海边旅游 (taking holiday by seaside) 38%31% 海水污染 people travelling abroad is _______- in 1998, but in 2008, it __________________12%,__________( 因为 )many people’s income increase. 11% increased bybecause

12
下表为某市 1998 年与 2008 年人们度假 方式的情况比较及其原因 年度 19982008 原因 境外旅游 ( traveling abroad ) 11%22% 收入增加 海边旅游 (taking holiday by seaside) 38%31% 海水污染 The percentage of( 百分比 ) taking holiday by seaside ______________ 7% in 2008, ___________________ that the water is polluted. The percentage of( 百分比 ) taking holiday by seaside ______________ 38% _____31%. the reason is fell by dropped fromto
 taking holiday by seaside ______________ 38% _____31%. the reason is fell by dropped fromto.")
13
Have a try Style: 图表说明文 Main tense: 一般过去时 Person: 第三人称

14
Have a try Describe the graph and give some possible reasons.

15
Have a try As can be seen from the graph, the sale figures of cars in Wenzhou experienced a steadily rise in the past four years. ____________________________________________________ ____________________________________________________ The figures lead us to the conclusion that more and more cars will appear in Wenzhou. 收入增加 income increase 国家政策 government policy 道路加宽 road widen The data detail: The reasons:

16
As can be seen from the graph, the sale figures of cars in Wenzhou experienced a steady rise in the past four years.The number of car in 2006 rose from 56 thousand to117 thousand in 2007, and then it gradually increased to155 thousand in 2008. However, the number in 2009 Went up rapidly, which is twice as big as that in 2007. I think the fact that the income increase and government policy may account for the new trend. In short,the figures lead us to the conclusion that more and more cars will appear in Wenzhou.

17
1. Polish your writing after class and double check it with your deskmates. 2. Surf the Internet to find other such passages. Homework

Similar presentations

![首 页 首 页 上一页 下一页 本讲内容 投影法概述三视图形成及其投影规律平面立体三视图、尺寸标注 本讲内容 复习: P25~P31 、 P84~P85 作业: P7, P8, P14[2-32(2) A3 (1:1)]](/12/3353742/big_thumb.jpg "首 页 首 页 上一页 下一页 本讲内容 投影法概述三视图形成及其投影规律平面立体三视图、尺寸标注 本讲内容 复习: P25~P31 、 P84~P85 作业: P7, P8, P14[2-32(2) A3 (1:1)]>")


 离散数学. 最后,我们构造能识别 A 的 Kleene 闭包 A* 的自动机 M A* =(S A* , I , f A* , s A* , F A* ) , 令 S A* 包括所有的 S A 的状态以及一个 附加的状态 s.>")
,n ∈ N +, 所以,数列 {x n } 的极限为 a, 就是 当自变量 n.>")


 复习: P107 ~ P115 作业: P48(6-2,6-4), P49( 去 6-6) P50, P51(6-13), P52 P50, P51(6-13), P52 P53 (6-18,6-20) P53 (6-18,6-20)>")


 Unit 8 新目标 八年级 ( 上 ) Unit 8 How was your school trip? Unit 8 How was your school trip? Section A Period 2.>")