Download presentation
Presentation is loading. Please wait.

1
What is MIS?

2
Two Specific Questions How can MIS be identified within academia? What differentiates high and low quality MIS research?

3
Method Determine fields related to MIS (Katerattankul, Han, & Rea, 2006) Gather article attributes from the Top 6-9 journals in each of these related fields and MIS
 Gather article attributes from the Top 6-9 journals in each of these related fields and MIS")
4
Disciplines MIS Education Accounting Computer Science Economics Sociology Psychology Library Science Healthcare Communication Management Marketing Electrical Engineering

5
Data Scrape ISIknowledge.com 102,388 articles Attributes analyzed included – Title – Publication – Abstract – Keywords – Citations per Year – References to other articles – Many more

6
Coded Articles 50 citation classics were randomly chosen from the MIS articles Matched with 50 non-citation classics on journal and publication year Coded each of these 100 articles in groups of 3 after a training session and 2 trials Attributes coded – Theoretical contribution – Type of article (Empirical, Theoretical, Review, Methodological) – Type of study
 – Type of study")
7
How can MIS be identified within academia?

8
Abstract Analysis Jaebong and John

9
Analysis of Research Paper Abstracts 9 Determine disciplines similar to MIS – Comparative definition of MIS discipline 13 Disciplines – MIS, Accounting, Communication, … Variables – 3 Numeric variables No. of authors No. of pages (end page – start page = no. of pages) No. of total citations (received to date) – 817 Text variables - nouns and noun phrases Extracted from abstracts
 No. of total citations (received to date) – 817 Text variables - nouns and noun phrases Extracted from abstracts.")
10
Descriptive Statistics 10 13 Disciplines; 38,642 Papers

11
Framework for Analysis 11 MISMgmtPsychology Computer Science … Global Vocabulary (817 distinct terms) Bag-of-Words for Each Paper Cluster Analysis Extract nouns and noun phrases by term frequency (TF) for each discipline Extract most frequent 150 terms from each discipline Result: 817 distinct terms Build a bag-of-words model for each paper Apply cluster analysis to bag- of-words from papers
 Bag-of-Words for Each Paper Cluster Analysis Extract nouns and noun phrases by term frequency (TF) for each discipline Extract most frequent 150 terms from each discipline Result: 817 distinct terms Build a bag-of-words model for each paper Apply cluster analysis to bag- of-words from papers")
12
5 Naturally Formed Clusters 12 Total # of papers: 38,642 No. of papers / cluster

13
1 Info Systems for Decision Support 13 10 Top Keywords from Abstracts Decision Support System (DSS) Information System Software Organization Database Web Collaboration Knowledge Information retrieval ● Core: Library Science ● Communication-based ● Not psychology
 Information System Software Organization Database Web Collaboration Knowledge Information retrieval ● Core: Library Science ● Communication-based ● Not psychology")
14
2 Organizational Behavior 14 10 Top Keywords from Abstracts Transformational leadership Leader-member exchange (LMX) Relational uncertainty Organizational citizenship behavior (OCB) Organizational commitment Leadership Satisfaction Culture Meta-analysis Social movement ● Human side ● Sociology in business school ● Collaborative
 Relational uncertainty Organizational citizenship behavior (OCB) Organizational commitment Leadership Satisfaction Culture Meta-analysis Social movement ● Human side ● Sociology in business school ● Collaborative")
15
3 Electrical Engineering & Healthcare 15 10 Top Keywords from Abstracts Inverter Induction motor Sensor Topology Mobile robot Neural network Architecture System Support vector machine (SVM) Genetic algorithm (GA) ● Technical side ● Data-driven ● Not human
 Genetic algorithm (GA) ● Technical side ● Data-driven ● Not human")
16
4 Economics & Accounting 16 10 Top Keywords from Abstracts Earnings announcement Financial Accounting Standard Board (FASB) Sarbanes-Oxley Act (SOX) Audit fee Equilibrium Valuation Private information Bidder Earnings forecast Incentive ● Econ & Acct very similar ● No psychology ● Numbers-based
 Sarbanes-Oxley Act (SOX) Audit fee Equilibrium Valuation Private information Bidder Earnings forecast Incentive ● Econ & Acct very similar ● No psychology ● Numbers-based")
17
5 What MIS is NOT 17 10 Top Keywords from Abstracts Somatic symptom Body mass index Bipolar disorder Anxiety disorder (Major) depression (Psychiatric, Mental) disorder Physical activity Medication Blood pressure Competitive intelligence (CI) ● Outside business school ● Stress related ● MIS does not research
 depression (Psychiatric, Mental) disorder Physical activity Medication Blood pressure Competitive intelligence (CI) ● Outside business school ● Stress related ● MIS does not research")
18
Percent of Each Discipline in Clusters

19
MIS in Clusters

20
Keyword Analysis John and Yu-Kai

21
Keyword Analysis in a Nutshell Questions to be asked and addressed: – How to represent a discipline? Vector Space Model – Based on the representation, how to compare the relations/similarities among different disciplines? Cosine Similarity – How’s the relations/similarities between MIS and the other disciplines evolve over time?

22
Vector Space Model =

23
Cosine Similarity Illustration of cosine similarity

24
Similarity of MIS with the other Areas (measurement unit: each year) Similarity
 Similarity")
25
Similarity of MIS with the other Areas (measurement unit: every two years) computer science marketing management healthcare sociology education psychology electronical engineering accounting economics Similarity
 computer science marketing management healthcare sociology education psychology electronical engineering accounting economics Similarity")
26
Reference Analysis Justin G., Devi, Shan

28
Interaction of MIS vs others Indicators: – MIS Contribution (CMIS) – MIS Consumption (MISC) Contribution to MIS Who are buying ideas? CMIS

29
MIS Contribution

30
MIS Consumption Education MIS Consumption

31
Healthcare Education Library science

32
Citation Analysis using Google Motion Charts 1970 - 2009

33
Number of citations received by a discipline 1970 - 2009

35
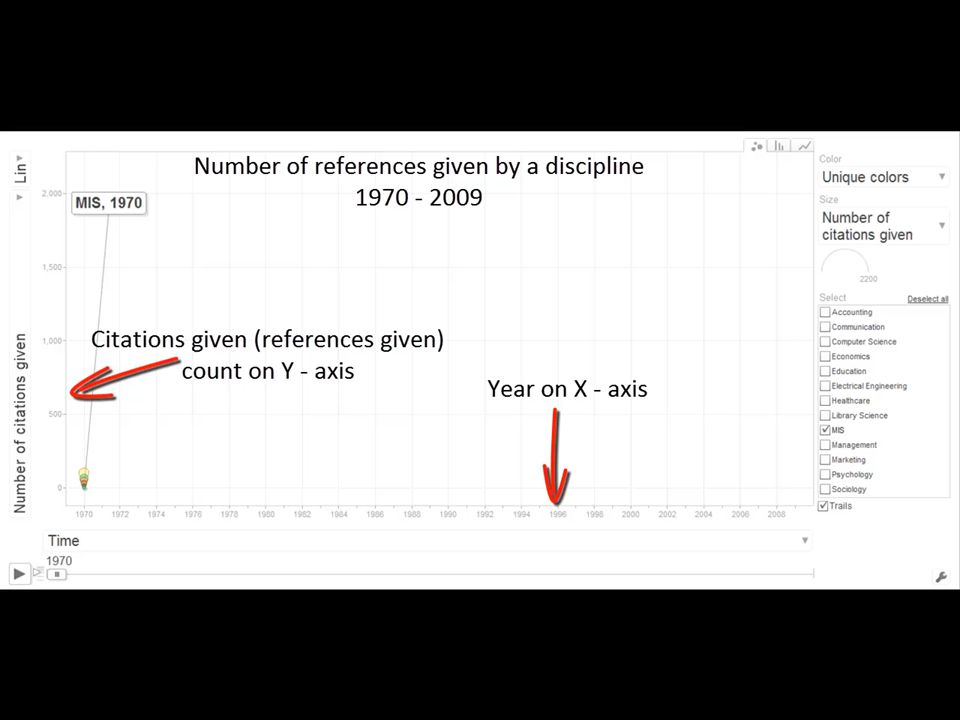
Number of references given by a discipline 1970 - 2009

37
Number of self citations by a discipline 1970 - 2009

39
Number of citations received Vs Number of references given 1970 - 2009

42
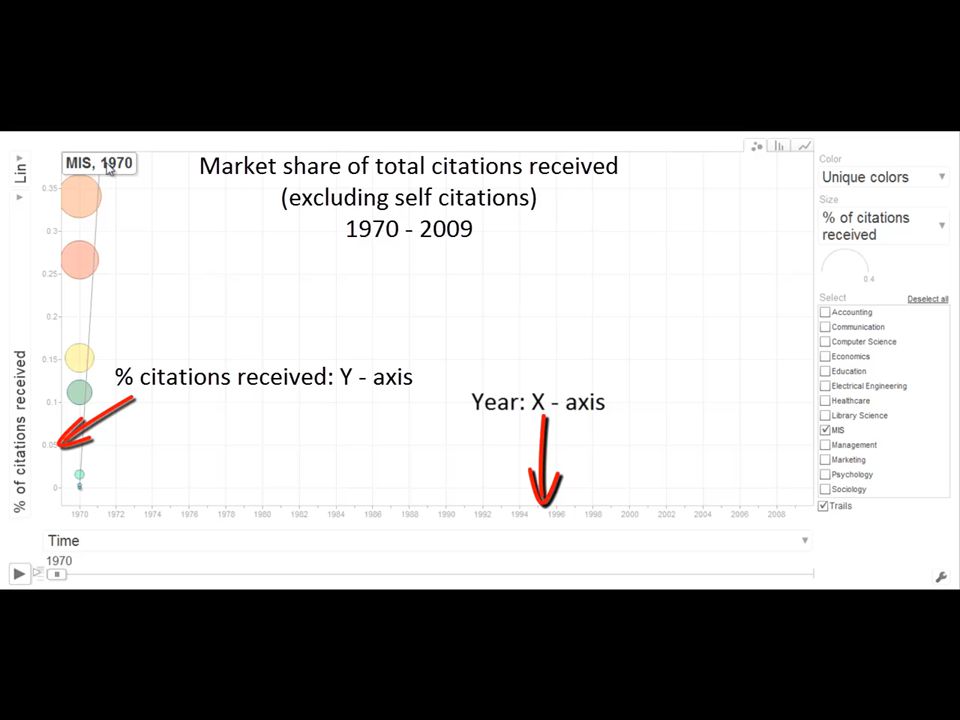
Market share of total citations received by a discipline 1970 - 2009

44
Market share of total references given by a discipline 1970 - 2009

46
What differentiates high quality and low quality articles in MIS? Dan, Julian, and Justin W.

47
Overview Identify factors that determine high quality MIS articles “High quality” = 100 or more citations Logistic regression models Dependent variable is binary variable called “quality” – 1 = high quality – 0 = not high quality

48
Analysis Analysis used 6 models – 2 “standard” models 5 or 6 explicit variables from ISI data set – 4 “conceptual phrase” models Numerous phrases derived from article title, author keywords and ISI keywords generated by text mining

49
Two “Standard” Models “Standard” model Years since publication Number of references Number of authors Number of pages Type of document “Standard” + name model Years since publication Number of references Number of authors Number of pages Type of document Name of journal* * Name of journal suspected of dominating “standard” model

50
Four “Conceptual Phrase ” Models Steps to find new possible “conceptual phrase” variables 1.Text-mine fields for most frequently used terms in – Article titles – Author keywords – ISI keywords 2.Group terms into conceptual phrases 3.Add conceptual phrases to “standard” models – “standard” + title – “standard” + author keywords – “standard” + ISI keywords – “standard” + title + author keywords + ISI keywords

51
Compare Model Performance TypeModelPerformance (R 2 ) Standard 0.135 StandardStandard + Journal Name0.304 Conceptual PhraseStandard + Article Title0.302 Conceptual PhraseStandard + Author Keyword0.232 Conceptual PhraseStandard + ISI Keyword0.247 Conceptual PhraseStandard + Title + Author + ISI0.479
 Standard StandardStandard + Journal Name0.304 Conceptual PhraseStandard + Article Title0.302 Conceptual PhraseStandard + Author Keyword0.232 Conceptual PhraseStandard + ISI Keyword0.247 Conceptual PhraseStandard + Title + Author + ISI0.479")
52
Key Factors in “High Quality” FactorsEvidence Number of pagesCoefficient = 0.053 Number of referencesCoefficient = 0.023 Age of paperCoefficient = 0.052 Keywords(see table) Name of journal(see table)
 Name of journal(see table)")
53
Factor: Keywords Research Contributions study Investigation research Theoretical Background theory perspective building Research Domains computing commerce TitleAuthor KeywordISI Keyword computing costeconomics building onlineresearch influence computingusers success qualitycomputer commerce usertheory research strategy theory technologyinformation technology media investigation perspective study TitleAuthor KeywordISI Keyword supportdecisiondesign information systems impact Positive Factors Negative Factors

54
Factor: Name of Journal Journal Citations Mean Citations Median Citations Mode MIS Quarterly60.31 310 Information Systems Research49.11 3012 Journal of Management Information Systems24.48 130, 13 Information & Management14.31 80 Journal of Strategic Information Systems12.86 70 European Journal of Information Systems12.55 80 Decision Support Systems12.17 72 Information Systems8.68 30 *626 articles published in MISQ received a total of 37,754 citations. The top 10 most cited MISQ articles received more than 20% of the total citations of MISQ articles.

55
10 Most Cited Articles – MISQ Article Name Citations Received Perceived Usefulness, Perceived Ease of Use, and User Acceptance of Information Technology2298 User acceptance of information technology: Toward a unified view897 Review: Knowledge management and knowledge management systems: Conceptual foundations and research693 Computer Self-Efficacy – Development of a Measure and Initial Test499 Perceived Usefulness, Perceived Ease of Use, and User Acceptance of Information Technology – A Replication454 Trust and TAM in online shopping: An integrated model448 The Measurement of End-User Computing Satisfaction413 A set of principles for conducting and evaluating interpretive field studies in information systems404 Task-Technology Fit and Individual-Performance398 The Case Research Strategy in Studies of Information Systems395

56
Article NameJournal Citations Received Perceived Usefulness, Perceived Ease of Use, and User Acceptance of Information Technology MISQ2298 User acceptance of information technology: Toward a unified view MISQ897 Understanding Information Technology Usage - A Test of Competing ModelsISR760 Review: Knowledge management and knowledge management systems: Conceptual foundations and research MISQ693 Computer Self-Efficacy – Development of a Measure and Initial Test MISQ499 The DeLone and McLean model of Information Systems Success: a Ten-Year UpdateJMIS463 Perceived Usefulness, Perceived Ease of Use, and User Acceptance of Information Technology – A Replication MISQ454 Trust and TAM in online shopping: An Integrated Model MISQ448 The Measurement of End-User Computing Satisfaction MISQ413 A set of principles for conducting and evaluating interpretive field studies in information systems MISQ404 10 Most Cited Articles – All Journals

57
High-Quality Articles

58
Determinants of Highly-Cited MIS Papers Jeff Proudfoot & Ryan Schuetzler

59
Analyses Logistic Regression Matched Pair Logistic Regression

60
Best Model

61
Theory Comparison

62
Matched Pair Logistic Regression Articles paired on year and journal One highly cited (>=100 citations) One non-highly cited (<100 citations) Analyze variables to determine what is significant in predicting the highly cited paper
 One non-highly cited (<100 citations) Analyze variables to determine what is significant in predicting the highly cited paper")
63
Most Significant Main Effect coefexp(coef)se(coef)zp TheoryTesting0.5121.670.3391.510.13
se(coef)zp TheoryTesting")
64
Theory Testing > Theory Building? Technology evolves, so a lot of work is done in applying old theories to new technological paradigms Many theories used in IS are borrowed from other fields, so building is not as prevalent as testing it in the IS domain

65
Conditional Logistic Regression coefexp(coef)se(coef)zp Theory Testing-1.9240.14601.26-1.530.130 Theory Building-2.3800.09261.33-1.790.074 Testing*Building0.9442.57060.472.010.044
se(coef)zp Theory Testing Theory Building Testing*Building")
66
Possible Reasons Neither Theory Testing nor Theory Building is enough to constitute a valuable paper alone. A strong combination of Testing and Building produce the most valuable works

67
Matched Pairs Logistic Regression Management Empirical Articles coefexp(coef)se(coef)z Build New Theory***1.1532363.1684290.10784110.694 Test Existing Theory***0.6606931.9361340.1046426.314 Refs***0.0168991.0170430.0047543.555 Reading Comp*0.1977581.2186670.0777362.544 Validity***1.1331523.1054290.1659156.83 Rsquare= 0.277 (max possible= 0.454 ) Likelihood ratio test= 492.1 on 6 df, p=0 Wald test = 173.1 on 6 df, p=0 Score (logrank) test = 349.6 on 6 df, p=0
se(coef)z Build New Theory*** Test Existing Theory*** Refs*** Reading Comp* Validity*** Rsquare= (max possible= ) Likelihood ratio test= on 6 df, p=0 Wald test = on 6 df, p=0 Score (logrank) test = on 6 df, p=0")
68
Non-Empirical Articles coefexp(coef)se(coef)zPr(>|z|) Theoretical Contribution** *0.2895561.3358350.058064.9876.13E-07 Refs**0.0105921.0106480.0037142.8520.00435 Reading Comp*0.2437181.2759840.1103112.2090.02715 Rsquare= 0.128 (max possible= 0.39 ) Likelihood ratio test= 63.33 on 4 df, p=5.783e-13 Wald test = 36.87 on 4 df, p=1.920e-07 Score (logrank) test = 51.62 on 4 df, p=1.656e-10
se(coef)zPr(>|z|) Theoretical Contribution** * E-07 Refs** Reading Comp* Rsquare= (max possible= 0.39 ) Likelihood ratio test= on 4 df, p=5.783e-13 Wald test = on 4 df, p=1.920e-07 Score (logrank) test = on 4 df, p=1.656e-10")
69
Conclusions MIS seems to be a multidisciplinary and maturing field There seem to be at least two identifiable areas within MIS – Behavioral and Technical Over time MIS seems to be becoming more behavioral and less technical Although theory testing has been more important than theory building in the past, as the discipline matures it is likely that theory building will emerge as the dominant paradigm for research in MIS

Similar presentations


 IS seminar, Spring 2007 Copyright 2007.>")

 Article overview presented by: Karen Bray Emilie Martin Trung (John)>")


