Download presentation
Presentation is loading. Please wait.

1
Red Lake River Farm to Stream Tile Drainage Study - Red Lake Watershed District –

2
Project Background

3
Theories

4
Water Quality Comparisons

7
Thief River Watershed Marshall/Beltrami Co. Project Area

8
Marshall County Sites

9
Red Lake Co. Project Area Wild Rice Paddy Monitoring Clearwater River Watershed

10
Red Lake County Sites

11
Clearwater County (Wild Rice) Sites
 Sites")
12
Tile Water Quality Findings Conventional Agriculture

13
Tile Outlet Comparisons

14
Marshall Co. Gravity Tile Red Lake Co. Gravity Tile Marshall Co. Pumped Tile Natural Background

15
Surface Drainage Water Quality

16
Surface Versus Tile Conventional Ag AVERAGES SurfaceTile Total Phosphorus (mg/L)0.87.02 Total Suspended Solids (mg/L)124.921.96 Nitrates (mg/L)2.5721.31 Total Nitrogen (mg/L)5.6122.36 Turbidity (NTU)149.58.71
 Total Suspended Solids (mg/L) Nitrates (mg/L) Total Nitrogen (mg/L) Turbidity (NTU)")
17
Drainage vs. Natural Background Levels - Comparable or Better -

18
Drainage vs. Natural Background Levels - Cause for Concern -

19
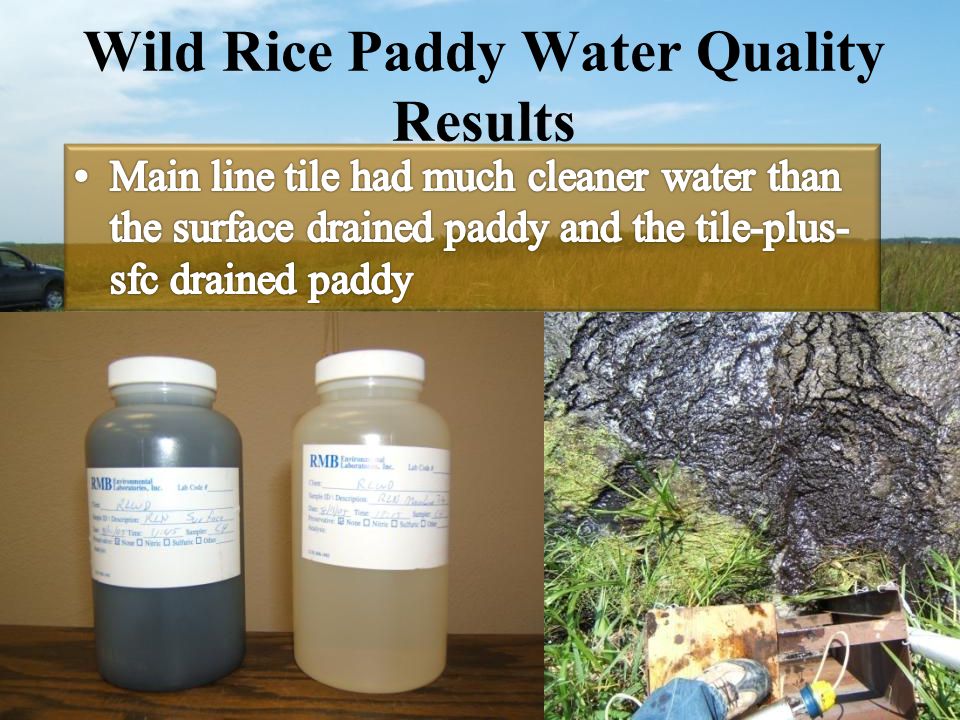
Wild Rice Paddy Water Quality Results

21
VS. Sfc. ML Tile

22
Wild Rice Main Line Tile Win–Win Solution

23
Wild Rice Paddy Sfc. Drainage Impact on the Clearwater River

25
Wild Rice Paddy Results – Impact on Clearwater River

27
FLOW

28
Flow Comparison Theories Being Tested

29
How is flow measured?

32
Peak Flows

33
More Information More Questions

34
Future Plans

35
Questions? More information is available on the RLWD website: http://www.redlakewatershed.org/projects.html#RLWFTSTile Corey Hanson coreyh@wiktel.com 218-681-5800

Similar presentations


 Irrigated Lands Regulatory Program (ILRP) Sierra Water Workgroup Summit June 11-13, 2013 Kings Beach, CA Presented.>")

 in water Soil in the water is an important nonpoint source of.>")

 Intake Stessor.>")


