Download presentation
Presentation is loading. Please wait.

1
How they work Tom Schneider, CPESC President SCIECA EPA Region 6 MS4 Conference July 7, 2011 San Antonio, Texas

2
Removal of the sediment from the storm water runoff prior to it reaching surface waters.

3
Prevent sediment from exiting the site. Sediment control are utilized from the time the soil is disturbed until the construction activity has ceased. At which time either temporarily or permanently erosion control can occur. Erosion control cannot be utilized to control sediment for active areas of disturbance on construction sites.

4
TTopography ◦L◦Length of slope ◦P◦Percent of slope SSoil type ◦S◦Sand ◦S◦Silt ◦C◦Clay Storm type ◦ Volume of runoff ◦ Rate of runoff

5
First we need to understand how the sediment control will remove the sediment. ◦ Sedimentation ◦ Filtration

6
Sedimentation Filtration

7
What is the one thing that we can look too that will give us a conclusive prediction of the effectiveness of a sedimentation control? Time

8
When runoff is detained a sufficient amount of time the sediment will settle out of the storm water runoff and will not exist the site. If the runoff exits the control prior to the required settling time, sediment will exit the control with the runoff.

9
I think they need a little more time.

10
What determines the amount of time that the runoff will need to be detained? Soil Type

11
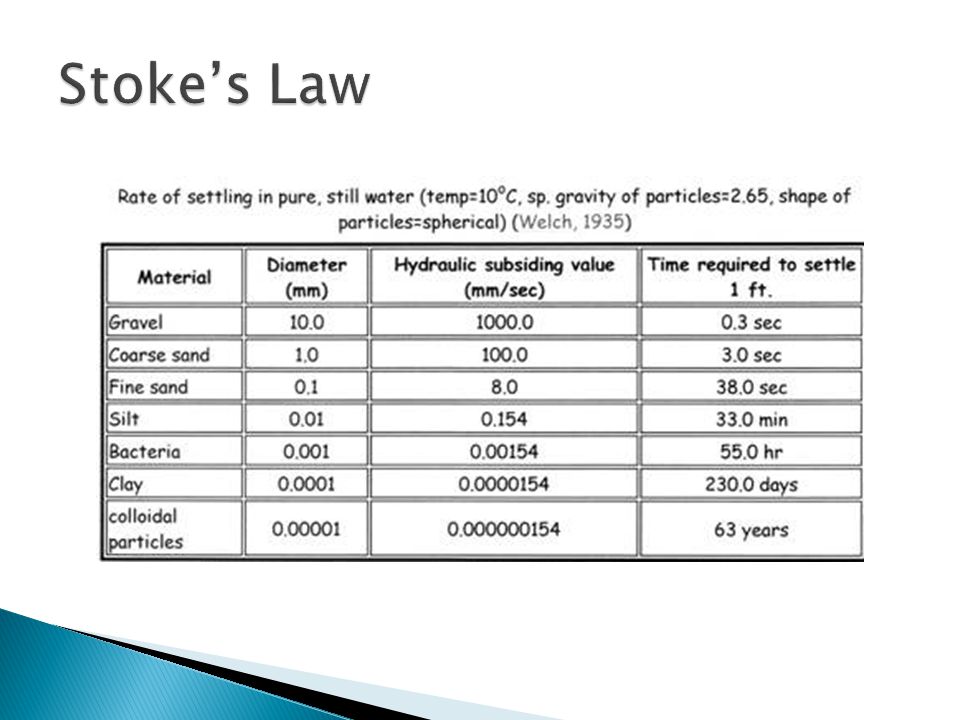
38 seconds = 1 foot Sand 230 days = 1 foot Clay 33 minutes = 1 foot Silt

13
Sedimentation ◦ Time required Soil type % sand % silt % clay ◦ Filtration

14
Determine the flow rate to the control ◦ Every control location will have a unique flow rate. Geographic location Topography Soil type LOCATION OF THE CONTROL ON THE SITE Determines the drainage area of the control TR55 ◦ Is an accepted flow rate model used by engineers for the design of storm drainage systems.

15
Relate the Time required to the Flow rate into the control. ◦ Based on the sites conditions I have flow rate of 2 cfs (cubic feet per second). ◦ Based on the sand silt soil type I need to retain the runoff 33 minutes (1980 seconds) ◦ 1980 seconds x 2 cfs= 3960 cf Capacity ◦ 3960cf / 2cfs = 1980 seconds ◦ Capacity = Time ◦ Based on the location of the control and the soil type of the site if the control detains 3960 cf of storm water runoff it will provide the amount of time required to remove the sediment.
. ◦ Based on the sand silt soil type I need to retain the runoff 33 minutes (1980 seconds) ◦ 1980 seconds x 2 cfs= 3960 cf Capacity ◦ 3960cf / 2cfs = 1980 seconds ◦ Capacity = Time ◦ Based on the location of the control and the soil type of the site if the control detains 3960 cf of storm water runoff it will provide the amount of time required to remove the sediment..")
16
2cfs 1,980 seconds

17
Sedimentation ◦ Time required Soil type % sand % silt % clay ◦ Capacity requirement Flow rate Time required Filtration

18
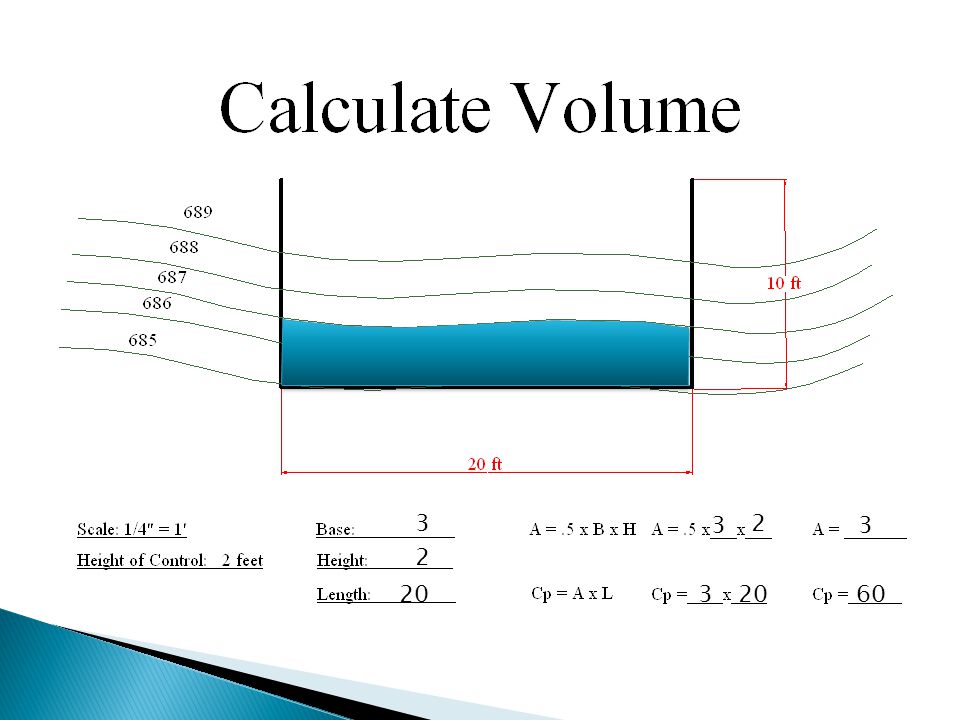
Determining the capacity of the control Configuration Height Length Aspect to the topography Capacity (volume) equals Time ◦ The larger the volume the more time provided
 equals Time ◦ The larger the volume the more time provided")
24
20 2 2 999 9180

28
3 2 20 3 2 3 3 60
30
Predictable performance.

31
The solution is not more rows of the control the solution is to provide more time

32
Does it matter what the control is made of? Not really

33
Hay bales, Rock berm, Concrete, Straw waddles, Marshmallows. The result will be the same.

34
Location, Location, Location The bottom of the slope is not always the best location

35
Sedimentation ◦ Time required Soil type % sand % silt % clay ◦ Capacity requirement Flow rate Time required ◦ Capacity provided Height of control Topography Filtration

36
Based on the soil I know how long I need to retain the runoff. Based on the location of the control I know the flow rate of the runoff to the control. Based on the soil type and flow rate I know the volume of water the control needs to detain to be successful. (volume=time) Based on the location of the control I know the volume of water that my control will detain. (Time = Effectiveness)
 Based on the location of the control I know the volume of water that my control will detain. (Time = Effectiveness).")
37
The term "efficient" is very much confused and misused with the term "effective". In general, efficiency is a measurable concept. In several of these cases, efficiency can be expressed as a result as percentage of what ideally could be expected, hence with 100% as ideal case. Compare “effectiveness”, which is a vague, non-quantitative concept, mainly concerned with achieving objectives.

38
For sedimentation controls efficiency and effectiveness are close to the same thing and are determined by amount of time the runoff is detained and the soil type contained within the drainage area of the control. Filtration controls efficiency and effectiveness are not as closely connected. The efficiency can be high and the effectiveness be low.

39
SoilPercentSecondsMinutesHoursDays Sand97%380.63330.0105560.000439815 Silt3%1980330.50.022916667 Clay0%19,872,000331,2005,220230 Flow rate of 2cfs 1,980 seconds x 2 cfs = 3,960 cf 3,960cf/2cfs=1,980 seconds Control volume 3,960 cf What percent of the sediment load did the control stop?

40
SoilPercentSecondsMinutesHoursDays Sand66%380.63330.0105560.000439815 Silt24%1980330.50.022916667 Clay10%19,872,000331,2005,220230 Flow rate of 2cfs 19,872,000 seconds x 2 cfs = 39,744,000 cf 39,744,000cf/2cfs=19,872,000 seconds Control volume 3,960 cf or What percent of the sediment load did the control stop? 1980 seconds

41
SoilPercentSecondsMinutesHoursDays Sand10%380.63330.0105560.000439815 Silt22%1980330.50.022916667 Clay68%19,872,000331,2005,220230 Flow rate of 2cfs 19,872,000 seconds x 2 cfs = 39,744,000 cf 39,744,000cf/2cfs=19,872,000 seconds Control volume 3,960 cf or What percent of the sediment load did the control stop? 1980 seconds

42
Sedimentation ◦ Time required Soil type % sand % silt % clay ◦ Capacity requirement Flow rate Time required ◦ Capacity provided Height of control Topography ◦ Effectiveness Capacity provided Soil type Filtration

44
Performance driven requirement based on NTUs (Nephelometric Turbidity Units) Controls will need to be designed to provide for the removal of the sediment not designed to meet the permit requirements NTUs correlate more to the color of the soil than sediment load in the soil.
 Controls will need to be designed to provide for the removal of the sediment not designed to meet the permit requirements NTUs correlate more to the color of the soil than sediment load in the soil.")
45
Sedimentation ◦ Time required Soil type % sand % silt % clay ◦ Capacity requirement Flow rate Time required ◦ Capacity provided Height of control Topography ◦ Effectiveness Capacity provided Soil type Soil color Filtration

46
What is the one thing that we can look too that will give us a conclusive prediction of the effectiveness of a filtration control? There is not one. We need to look at ◦ Storm water runoff flow rate ◦ Soil type ◦ Filter media opening size ◦ Filter media flow rate ◦ Size of the filter area

47
Determine the flow rate to the control ◦ Every control location will have a unique flow rate. Geographic location Topography Soil type LOCATION OF THE CONTROL ON THE SITE Determines the drainage area of the control TR55 ◦ Is an accepted flow rate model used by engineers for the design of storm drainage systems.

48
Soil type will determine what filter media would be appropriate. Sand SiltClay

49
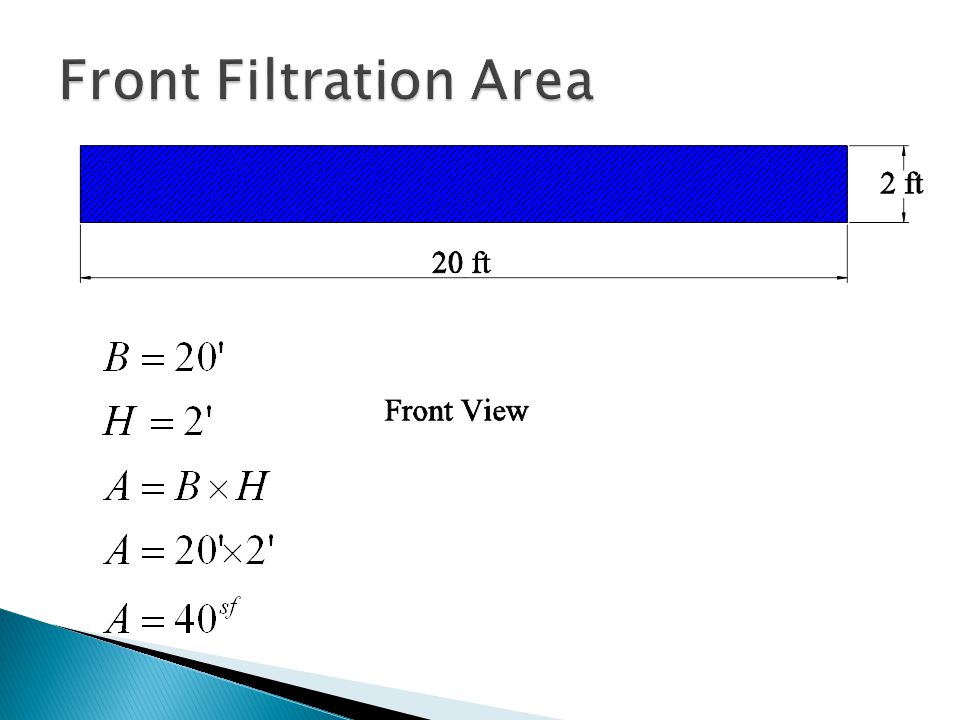
Criteria for selecting the correct filter media ◦ What size soil particles will pass through the filter. ◦ Flow rate of the filter media (how much water will pass through it in a given time per square foot). ◦ How many square feet will be able to filter runoff.
. ◦ How many square feet will be able to filter runoff..")
50
SoilPercentMedia 1Media 2Media 3Media 4 Sand10% Yes Silt22% Yes No Clay68% Yes NoYesNo What percent of the sediment load did the control stop? No one knows all we know is the efficiency of the filter media. 100%32% 100% 10%

51
Sedimentation ◦ Time required Soil type % sand % silt % clay ◦ Capacity requirement Flow rate Time required ◦ Capacity provided Height of control Topography ◦ Effectiveness Capacity provided Soil type Soil color Filtration ◦ Efficiency Soil size and distribution Filter media opening size

52
SoilPercentMedia 1Media 2Media 3Media 4 Sand10% Yes Silt22% Yes No Clay68% Yes NoYesNo Efficiency100%32%100%10% 10 GPM/ 0.02cfs 35 GPM/ 0.077cfs 2GPM/ 0.0044cfs 150GPM/ 0.33 cfs

53
Sedimentation ◦ Time required Soil type % sand % silt % clay ◦ Capacity requirement Flow rate Time required ◦ Capacity provided Height of control Topography ◦ Effectiveness Capacity provided Soil type Soil color Filtration ◦ Efficiency Soil size and distribution Filter media opening size ◦ Capacity Flow rate of media

58
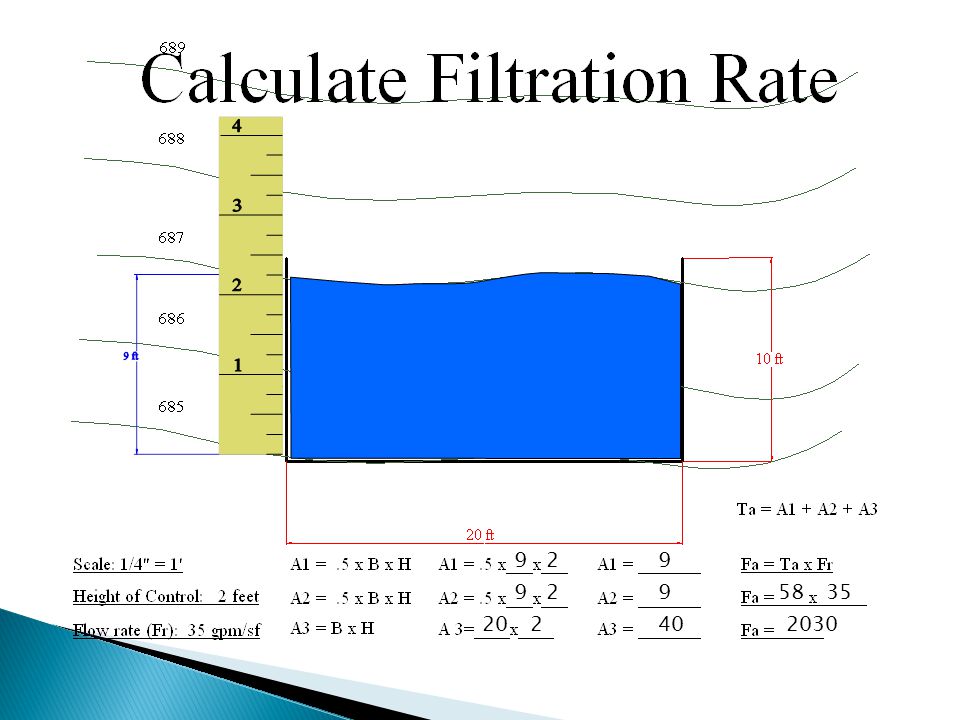
20402 299 9958235 2030
59
Sedimentation ◦ Time required Soil type % sand % silt % clay ◦ Capacity requirement Flow rate Time required ◦ Capacity provided Height of control Topography ◦ Effectiveness Capacity provided Soil type Soil color Filtration ◦ Efficiency Soil size and distribution Filter media opening size ◦ Capacity Flow rate of media Filter area

60
SoilPercentMedia 1Media 2Media 3Media 4 Sand10% Yes Silt22% Yes No Clay68% Yes NoYesNo Efficiency100%32%100%10% Flow Rate10 GPM/ 0.02cfs 35 GPM/ 0.077cfs 2GPM/ 0.0044cfs 150GPM/ 0.33 cfs Area58 Sf Capacity 580gpm/ 1.288cfs 2030gpm/ 4.51cfs 116gpm/ 0.257cfs 8700gpm/ 19.33cfs

61
Sedimentation ◦ Time required Soil type % sand % silt % clay ◦ Capacity requirement Flow rate Time required ◦ Capacity provided Height of control Topography ◦ Effectiveness Capacity provided Soil type Soil color Filtration ◦ Efficiency Soil size and distribution Filter media opening size ◦ Capacity Flow rate of media Filter area Filter Capacity

62
Once the volume capacity of the filtration control is exceeded the sediment laden storm water runoff will bypass the control and carry the sediment with it.

63
SoilPercentMedia 1Media 2Media 3Media 4 Sand10% Yes Silt22% Yes No Clay68% Yes NoYesNo Efficiency100%32%100%10% Flow Rate10 GPM/ 0.02cfs 35 GPM/ 0.077cfs 2GPM/ 0.0044cfs 150GPM/ 0.33 cfs Area58 Sf Capacity 580gpm/ 1.288cfs 2030gpm/ 4.51cfs 116gpm/ 0.257cfs 8700gpm/ 19.33cfs Flow rate to the control 2cfs Percent treated 64%100%12%100%

64
Sedimentation ◦ Time required Soil type % sand % silt % clay ◦ Capacity requirement Flow rate Time required ◦ Capacity provided Height of control Topography ◦ Effectiveness Capacity provided Soil type Soil color Filtration ◦ Efficiency Soil size and distribution Filter media opening size ◦ Capacity Flow rate of media Filter area Filter Capacity ◦ Percent treated Filter capacity Flow rate of runoff

65
SoilPercentMedia 1Media 2Media 3Media 4 Sand10% Yes Silt22% Yes No Clay68% Yes NoYesNo Efficiency100%32%100%10% Flow Rate10 GPM/ 0.02cfs 35 GPM/ 0.077cfs 2GPM/ 0.0044cfs 150GPM/ 0.33 cfs Area58 Sf Capacity 580gpm/ 1.288cfs 2030gpm/ 4.51cfs 116gpm/ 0.257cfs 8700gpm/ 19.33cfs Flow rate to the control 2cfs % of runoff treated 64%100%12%100% % sediment retained 64%32%12%10%

66
SoilPercentMedia 1Media 2Media 3Media 4 Sand75% Yes Silt22% Yes No Clay3% Yes NoYesNo Efficiency100%97%100%75% Flow Rate10 GPM/ 0.02cfs 35 GPM/ 0.077cfs 2GPM/ 0.0044cfs 150GPM/ 0.33 cfs Area58 Sf Capacity 580gpm/ 1.288cfs 2030gpm/ 4.51cfs 116gpm/ 0.257cfs 8700gpm/ 19.33cfs Flow rate to the control 2cfs % of runoff treated 64%100%12%100% % sediment retained 64%97%12%75%

67
Sedimentation ◦ Time required Soil type % sand % silt % clay ◦ Capacity requirement Flow rate Time required ◦ Capacity provided Height of control Topography ◦ Effectiveness Capacity provided Soil type Soil color Filtration ◦ Efficiency Soil size and distribution Filter media opening size ◦ Capacity Flow rate of media Filter area Filter Capacity ◦ Percent treated Filter capacity Flow rate of runoff ◦ Sediment retained Efficiency Percent treated

68
The control (sedimentation and filtration) must provide not only adequate storage volume for the storm water runoff but also for the sediment that it will retain. If the control is designed to only provide for the storm water runoff volume then once the sediment starts to be retained the effectiveness of the control will be reduced. MUSLE is the correct model to predict sediment load on construction sites.

69
◦ USLE The equation that predicts longtime average soil losses and runoff from specific areas in specific cropping and management systems. The erosion values reflected by these factors can vary considerably due to varying weather conditions. Therefore, the values obtained from the USLE more accurately represent long- term averages. ◦ RUSLE RUSLE has the same formula as USLE, but has several improvements in determining factors. ◦ RUSLE2 model that predicts long-term, average-annual erosion by water and can be used for a broad range of farming, conservation, mining, construction, and forestry sites. ◦ MUSLE Predicts the amount of sediment delivered to a specified point during a specific storm event

70
Sedimentation Efficiency ◦ Is dependent on the time that the runoff is detained and soil type. Capacity ◦ Determined by volume of water detained by the control. Effectiveness is tied to Efficiency Filtration Efficiency ◦ Determined by soil type and filter opening size Percent treated ◦ Determined by wetted area and flow rate of filter. Effectiveness is equal to Efficiency x Percent treated

Similar presentations


 Josh Page CE 547 –>")


