Download presentation
Presentation is loading. Please wait.

1
Refractory Wear During Gasification Larry Baxter 1, Shrinivas Lokare 1, Humberto Garcia 2, Bing Liu 1 Clearwater Coal Conference Clearwater, FL June 2, 2009 1 Brigham Young University Provo, UT 2 Idaho National Laboratory * Idaho Falls, ID

2
Gasification in the Literature

3
Research by Country

4
Levelized Cost of Power

5
GE Energy Radiant Coal Slurry 63 wt.% 95% O 2 Slag/Fines Syngas 410°F, 800 Psia Composition (Mole%): H 2 26% CO 27% CO 2 12% H 2 O 34% Other 1% H 2 O/CO = 1.3 Design: Pressurized, single-stage, downward firing, entrained flow, slurry feed, oxygen blown, slagging, radiant and quench cooling To Acid Gas Removal or To Shift
: H 2 26% CO 27% CO 2 12% H 2 O 34% Other 1% H 2 O/CO = 1.3 Design: Pressurized, single-stage, downward firing, entrained flow, slurry feed, oxygen blown, slagging, radiant and quench cooling To Acid Gas Removal or To Shift")
6
ConocoPhillips E-Gas™ Coal Slurry 63 wt. % Stage 2 95 % O 2 Slag Quench Char Slag/Water Slurry Syngas 1,700°F, 614 psia Composition (Mole%): H 2 26% CO 37% CO 2 14% H 2 O 15% CH 4 4% Other 4% H 2 O/CO = 0.4 (0.78) (0.22) Stage 1 2,500 o F 614 Psia To Fire-tube boiler Design: Pressurized, two-stage, upward firing, entrained flow, slurry feed, oxygen blown, slagging, fire-tube boiling syngas cooling, syngas recycle To Acid Gas Removal or To Shift
: H 2 26% CO 37% CO 2 14% H 2 O 15% CH 4 4% Other 4% H 2 O/CO = 0.4 (0.78) (0.22) Stage 1 2,500 o F 614 Psia To Fire-tube boiler Design: Pressurized, two-stage, upward firing, entrained flow, slurry feed, oxygen blown, slagging, fire-tube boiling syngas cooling, syngas recycle To Acid Gas Removal or To Shift.")
7
Shell Gasification Syngas 350°F, 600 Psia Composition (Mole%): H 2 29% CO 57% CO 2 2% H 2 O 4% Other 8% H 2 O/CO = 0.1 Dry Coal Design: Pressurized, single-stage, downward firing, slagging, entrained flow, dry feed, oxygen blown, convective cooler Convective Cooler Soot Quench & Scrubber 95% O 2 HP Steam 650 o F Steam Source: “The Shell Gasification Process”, Uhde, ThyssenKrupp Technologies Syngas Quench 2 To Acid Gas Removal or To Shift HP Steam Slag Gasifier 2,700 o F 615 psia
: H 2 29% CO 57% CO 2 2% H 2 O 4% Other 8% H 2 O/CO = 0.1 Dry Coal Design: Pressurized, single-stage, downward firing, slagging, entrained flow, dry feed, oxygen blown, convective cooler Convective Cooler Soot Quench & Scrubber 95% O 2 HP Steam 650 o F Steam Source: The Shell Gasification Process , Uhde, ThyssenKrupp Technologies Syngas Quench 2 To Acid Gas Removal or To Shift HP Steam Slag Gasifier 2,700 o F 615 psia")
8
Transient Model Formulation

9
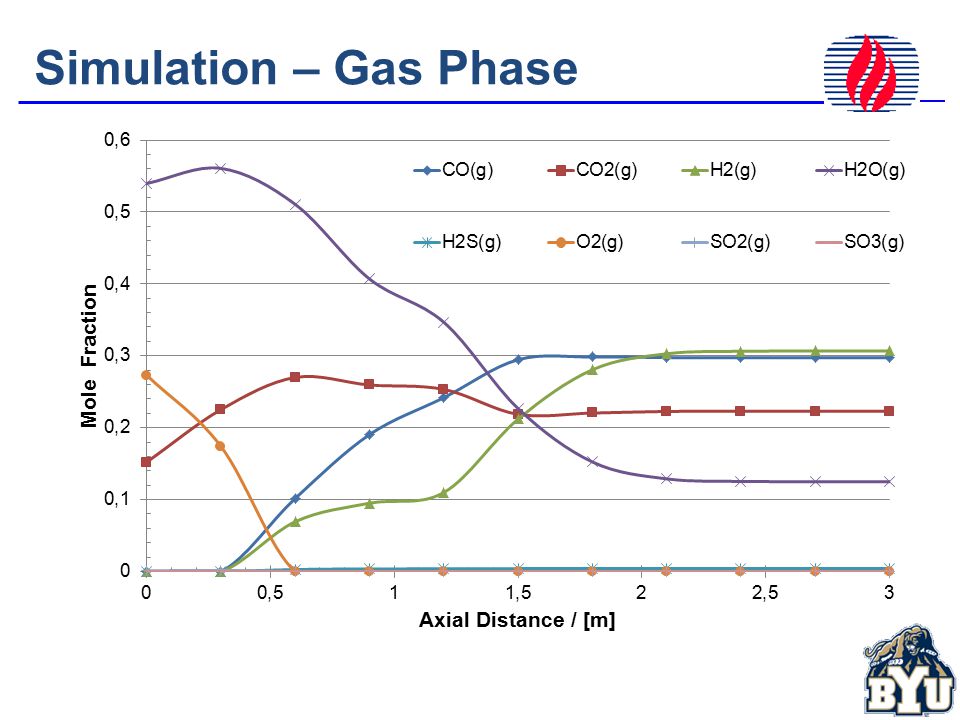
Simulation – Gas Phase

11
Efficiency Calculation

12
Impaction Efficiency Improvement abcd Potential Flow0.12381.34-0.0340.0289 Viscous Flow0.08681.9495-0.457877-0.047

13
Corrosion potential KClS Si Ca Fe Chlorides condensation is a major step in corrosion initiation

14
Complex Inorganic Chemistry

16
Al 2 O 3 -CaO-SiO 2 Chemistry Al 2 O 3 /SiO 2 = 0.34

17
Refractory-Slag Model

18
Slag Importance

19
Refractory Wear with Time

21
Sensitivity to CaO content

22
Refractory Chemical Corrosion

23
Spalling Mechanisms

24
Overall Refractory Wear Chemical dissolution rates depend in complex ways on diffusivities, viscosities, chemical reactions, and temperature. Spalling mechanisms and rates are not well understood, with quantitative models being mostly empirical. Net dissolution rates disproportionately depend on minor slag and refractory components, involving complex inorganic chemistry.

25
Spalling Mechanisms Spalling Corrosion

26
Spalling Mechanisms 1 2 3 4 5 6 Chemistry (weight %) Point 123456 - Al6.927.31.72.87.55.7 - Si23.90.20.1 40.23.8 - Fe20.831.723.60.21.50.5 - Ca1.5---0.5- - Cr0.11.542.762.11.553.0 Crystalline Phaseshercynite, fayalite, enstatite, Iron sulfide, iron cordierite, hermatite iron-alumina spinel iron-chrome spinel Chromia/alumina solid solutionFe-depleted slagAl build-up with Si
 Point Al Si Fe Ca Cr Crystalline Phaseshercynite, fayalite, enstatite, Iron sulfide, iron cordierite, hermatite iron-alumina spinel iron-chrome spinel Chromia/alumina solid solutionFe-depleted slagAl build-up with Si")
27
Refractory/Slag Profile Distance from Hot Face (mm) Bulk Chemistry (wt pct) X-Ray Crystalline Phases Cr 2 O 3 Al 2 O 3 SiO 2 CaOFe H.F. to 2.380.010.85.40.31.6 P= Cr 2 O 3 Tr=M*Cr 2 O 4 6.984.210.23.90.30.4 P= Cr 2 O 3 Tr=M*Cr 2 O 4 11.483.910.73.20.4 P= Cr 2 O 3 Tr=M*Cr 2 O 4 34.383.510.42.80.60.4P= Cr 2 O 3 43.383.99.32.30.50.2P= Cr 2 O 3 52.785.710.50.90.2 P= Cr 2 O 3 57.286.110.50.20.00.2P= Cr 2 O 3 12787.49.40.2 P= Cr 2 O 3

28
Conclusions Chemical dissolution and spalling account for most refractory wear. Both mechanisms depend on temperature, slag/refractory composition, and slag flow rates, approximately in that order. Temperature dependence arises from both transport and solubility issues. Both immersion and spinning cup analyses provide good corrosion information, but neither simulates practical systems. Temperature, not peak deposition rates, determine maximum corrosion location.

29
Acknowledgements PhD and post-doc students Shrinivas Lokare, Bing Liu developed many of the submodels. Partial financial support from U.S. Department of Energy contract DE-AC07-05ID14517 and from corporate sponsors.

Similar presentations


 and composition over which.>")

 X-Ray Diffraction Principle: interference of photons by reflection by ordered structures n = 2d sin >")


 WASTE VIA CATALYTIC STEAM GASIFICATION Chaouki Ghenai.>")
 ANH PHUONG NGUYEN APN274 25 Nov 2008 CHE 384 ENERGY TECHNOLOGY & POLICY.>")


