Download presentation
Presentation is loading. Please wait.

1
Practical Use of Asset Management and Structured Decision Making Case Study: Seattle Public Utilities Solid Waste Facilities Master Plan Presented by: Jenny Bagby Principal Economist Seattle Public Utilities May 2, 2006

2
Outline of Presentation Overview of Seattle’s waste management system Description of problem of planning for new facilities Use of three types of analysis to help choose among options –Benefit cost analysis –Value modeling –Decision analysis for modeling risk and uncertainty Conclusion

3
What is Seattle Public Utilities? City Department (our director reports to Mayor) 1200 employees including office professional folks as well as field staff Solid Waste Wastewater Drinking Water Surface Water (Drainage)
 1200 employees including office professional folks as well as field staff Solid Waste Wastewater Drinking Water Surface Water (Drainage).")
4
Project Background Long-range planning (30 + years) Involves collection, transfer, and disposal of municipal solid waste - Garbage, Yardwaste and Recyclables Primary customers affected are the self-haul customers at the recycling and disposal stations (RDS) and adjacent neighbors
 Involves collection, transfer, and disposal of municipal solid waste - Garbage, Yardwaste and Recyclables Primary customers affected are the self-haul customers at the recycling and disposal stations (RDS) and adjacent neighbors")
5
The Problem The City’s two transfer stations are old and outdated Transfer station reliability decreasing Transfer system inefficiencies Quality of customer service is decreasing Existing facilities lack flexibility

6
Many Existing Problems Safety concerns Old wiring Seismic retrofit needed High Maintenance (floors, compactor) Too many “band-aid” fixes
 Too many band-aid fixes")
7
System Overview Facilities Two city-owned transfer stations Two privately-owned transfer stations Two intermodal rail yards Two private processing facilities for recyclables Private processing facility for organics composting Private landfills

8
CRSHLT Municipal Garbage OrganicsRecyclables NRDSSRDS IM Private Transfer CRSH Landfill Organics Processing Recycle Processing Current Waste Flow Diagram R

9
System Overview Materials flow City-contracted collection and transfer of residential Garbage, Yardwaste and Recyclables City-contracted collection and transfer of commercial Garbage and organics Private collection of commercial recyclables Individual business and residential self-haul

13
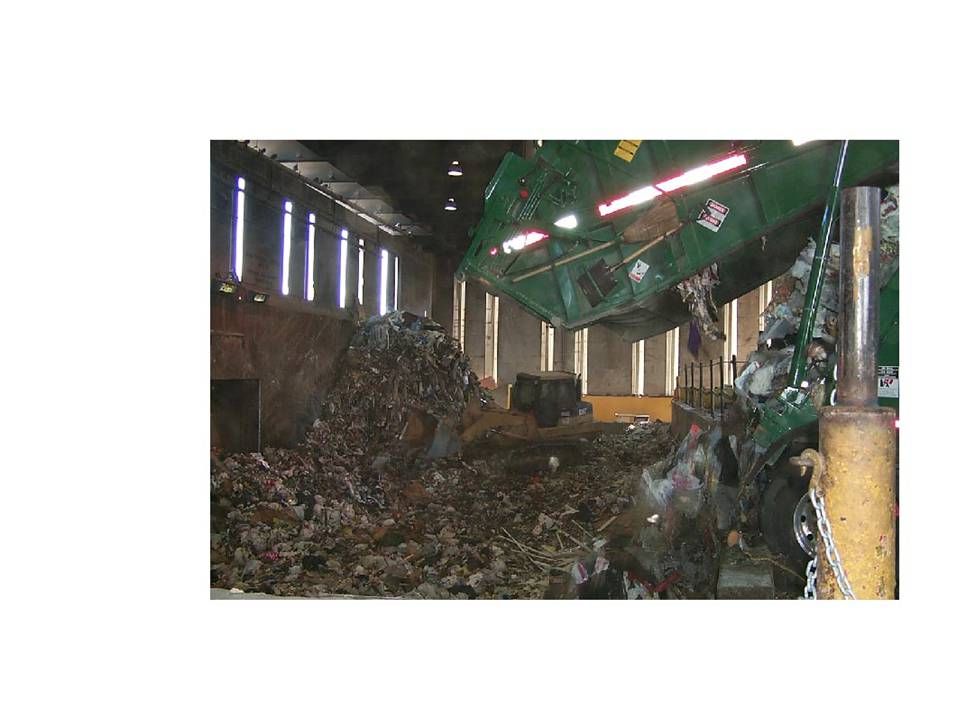
Solid Waste Facilities

18
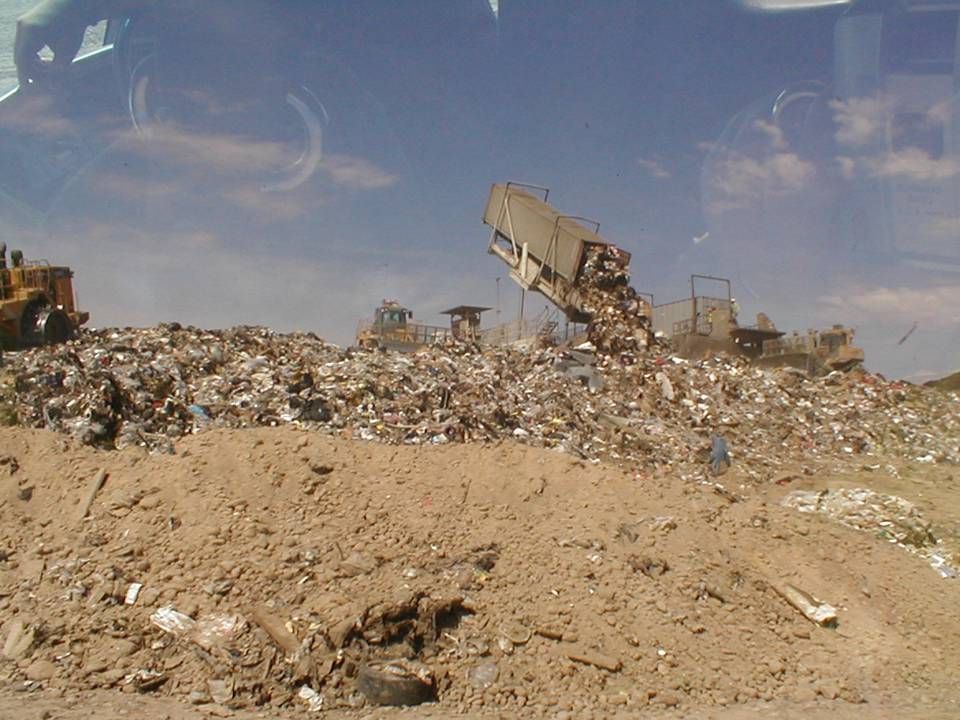
Rail Landfill Connection Two Railroad Companies Serve Seattle Most Large Regional Landfills are Linked by Rail Access to more than one rail line opens access to different landfills creating more competition

19
Rabanco - Burlington Northern/Santa Fe - Roosevelt Landfill

20
Waste Management Inc. - Union Pacific - Columbia Ridge Landfill

26
Understanding the System Public & private facilities work in conjunction with each other Waste flows to different facilities can change over time A flow change to one facility affects the others

27
Vertical Integration of Solid Waste Business Industry consolidation (fewer solid waste service companies than before) Companies strive to control all aspects of the market (collection, transfer, long-haul, and disposal) An integrated company can reduce operation costs, but may also reduce competition
 Companies strive to control all aspects of the market (collection, transfer, long-haul, and disposal) An integrated company can reduce operation costs, but may also reduce competition")
28
Project Objectives Improve transfer efficiency of solid waste and recyclables Improve self-haul customer service Minimize neighborhood impacts from transfer stations Increase reuse and recycling opportunities Provide long-term system flexibility

29
Primary Questions What is the appropriate mix of public and private facilities? Remodel or rebuild city stations? Do we need additional property at the city stations? Does a city-owned intermodal transfer station make economic sense?

30
Initial Assessment A city-owned facility is needed in north and south Seattle Siting options are limited; no substantially better sites were found for the City stations A third City-owned intermodal transfer facility needs to be evaluated

31
Enter Asset Management AKA Full Employment for Economists C/B Analysis on all decisions (especially ones this large) Emphasis on quantifying in $ terms everything we possibly can Challenging! CH2MHill to the rescue - Value Model and Decision Framework

32
Required Elements of an Effective Decision Framework Develop Value Model and Formulate Alternatives Develop Implementation Plan Organizational Analytical Solve the right problem Put interests & values first Avoid advocacy & positions Avoid useless data Find lowest cost solution Manage risk and liability Track progress Collect Meaningful, Reliable Data Evaluate Alternatives and Make Decision Frame the Problem Ensure Leadership and Commitment

33
The Options Key elements No action (required for EIS) - maintain operation and legal compliance Modifications to RDS - retain tipping sheds Total rebuild of RDS - including additional reuse and recycling facilities Add property to NRDS and/or SRDS Develop a City-owned transfer/intermodal facility
 - maintain operation and legal compliance Modifications to RDS - retain tipping sheds Total rebuild of RDS - including additional reuse and recycling facilities Add property to NRDS and/or SRDS Develop a City-owned transfer/intermodal facility")
34
Options Assessment Steps Develop options Identify Quality of Service goals & criteria Prepare conceptual layout designs for preferred options Model Costs, Risk and Quality of Service performance for preferred options Revise options based on results

35
Intermodal Site

36
South Recycling and Disposal Station Option 11

37
Asset Management We developed a cost model to quantify in dollars everything we could Goal was to compare each of the options using benefit-cost analysis What we couldn’t quantify we put into a value model to help display the other benefits or values of each option

38
System Cost Model Cost model calculates total system NET cost over 30 years of: Transfer Rail loading and hauling Processing Disposal Collection (IF option results in changes to collection costs)
")
39
System Cost Model Costs include: –Property Purchase/Lease –Construction Costs –Equipment Capital –Labor and Other O&M –Contractor payments such as Disposal, Private Transfer, Processing –Long term competitive benefits of partnering –Revenues from partner tons

40
Example Labor and Equipment Cost Model Inputs

41
Cost Results Option 4: Cost by Function $- $10,000,000 $20,000,000 $30,000,000 $40,000,000 $50,000,000 $60,000,000 $70,000,000 $80,000,000 20042006200820102012201420162018202020222024202620282030203220342036

43
Cost Results

44
Quality of Service Assessment Primary Services Provided Waste reduction & recycling Customer service Work environment Built environment (community) impacts Natural environment impacts
 impacts Natural environment impacts")
45
Shaded criteria/ sub-criteria receive performance scales, weights, and option scores. Natural and Built Environment Impacts are broken out by facility (NRDS, SRDS, Intermodal).
..")
46
Importance of Value Model Facilitated process Way to get all issues and concerns identified Moved discussion from a high level where things are hard to evaluate Began discussing what everyone really meant/valued when they held a certain position

47
PerformanceValue CriterionMeasureRate x Weight =Score A320 60 B445180 C110 10 D225 50 Total Score300 Quantified Evaluation Approach: Multi-Attribute Utility Theory

48
Quality of Service Assessment Non-monetizable Quality of Service benefits were quantified in a variety of ways such as Length of time queuing Square feet of space available for operations 1-5 scale - best professional judgement etc.

49
SPU Solid Waste Facility Masterplan Contributions by Criteria - Total Quality of Service Score Note: Option 5 and 11 score highest on waste reduction. This is the differentiating for its leading score. Used Criterium Decision Plus Software

50
Insert Cost Risk Profile Graph and Tornado diagram Cost ($M) Option Score Overall Results Quality of Service vs. Cost 0 0.2 0.4 0.6 0.8 1 480516552588624660 Option 5 Option 1 Option 4A Option 2A Option 3 Option 0 Option 2B Option 4B Option 6 Option 7

51
SPU SW Facilities Masterplan SPU SW Facilities Masterplan Approach to Capture Cost Risk

52
Cost Drivers and Uncertainties Affecting NPV of Options The Influence Diagram below illustrates conditional relationships between decisions (yellow rectangles), uncertainties (green ovals), & outcomes (blue boxes).
, uncertainties (green ovals), & outcomes (blue boxes).")
53
Step 2: Potential Cost Outcomes and Probabilities Tool: Decision Tree For each possible outcome of a decision, Decision Trees show: The Pathway - How did this happen? The Probability - How likely is this? The Cost - How much will this outcome cost? No Additional Facilities Prob = 100% C = $0 M Forecast Prob = 70% Prob = 20% C = $10M New Facilities Needed Prob = 80% C = $30M Above Forecast Prob = 30% Growth in Waste Stream Future Capital Costs Tools Used –DPL software Interaction –Workshop and/or questionnaires to define branch outcomes and estimate probabilities and costs The influence diagram is actually the top layer of a mathematical model. The underlying model is a series of interconnected decision trees. In our simplified example only possible one tree is shown (above). Example Facility Expansion
. Example Facility Expansion.")
54
Calculating the Decision Tree [Example Tree] Prob of Outcome = 0.7 * 1.0 = 0.7 Cost of Outcome = $0 Prob of Outcome = 0.3 * 0.2 = 0.06 Cost of Outcome = $10M Prob of Outcome = 0.3 * 0.8 = 0.24 Cost of Outcome = $30M Costs (NVP): No Additional Facilities = $0M Facility Expansion = $10M New Facilities Needed = $30M No Additional Facilities Prob = 100% C = $0 M Forecast Prob = 70% Prob = 20% C = $10M New Facilities Needed Prob = 80% C = $30M Above Forecast Prob = 30% Growth in Waste Stream Future Capital Costs Facility Expansion The influence diagram is actually the top layer of a mathematical model. The underlying model is a series of interconnected decision trees. In our simplified example only possible one tree is shown (see below).
![Calculating the Decision Tree [Example Tree] Prob of Outcome = 0.7 * 1.0 = 0.7 Cost of Outcome = $0 Prob of Outcome = 0.3 * 0.2 = 0.06 Cost of Outcome = $10M Prob of Outcome = 0.3 * 0.8 = 0.24 Cost of Outcome = $30M Costs (NVP): No Additional Facilities = $0M Facility Expansion = $10M New Facilities Needed = $30M No Additional Facilities Prob = 100% C = $0 M Forecast Prob = 70% Prob = 20% C = $10M New Facilities Needed Prob = 80% C = $30M Above Forecast Prob = 30% Growth in Waste Stream Future Capital Costs Facility Expansion The influence diagram is actually the top layer of a mathematical model.](http://images.slideplayer.com/13/3810391/slides/slide_54.jpg "The underlying model is a series of interconnected decision trees. In our simplified example only possible one tree is shown (see below)..")
55
Decision Trees: Probabilities and Cost Outcomes Example: Rail Savings Scenario/ Probability Outcome ($/ton.) S1 Merchandise Train P = 20% 16.80 14.70 Without King County (Rail) 13.40 12.90 P = 60% With King County (Rail) P = 40% S2 - SPU waste w/ others P = 80% S3 - SPU Waste w/KC P = 70% S4 SPU/KC + shared loading P = 30% Intermodal Yes 0.00 Intermodal No
 S1 Merchandise Train P = 20% Without King County (Rail) P = 60% With King County (Rail) P = 40% S2 - SPU waste w/ others P = 80% S3 - SPU Waste w/KC P = 70% S4 SPU/KC + shared loading P = 30% Intermodal Yes 0.00 Intermodal No")
56
Uncertainty Branch - Disposal Savings with Intermodal Scenario/ Probability Outcome ($savings/ton.) 0 0 -2 Without King County P = 50% With King County P = 50% No: P = 60% Yes: P = 40% No: P = 60% Yes: P = 40% Intermodal - Yes
 Without King County P = 50% With King County P = 50% No: P = 60% Yes: P = 40% No: P = 60% Yes: P = 40% Intermodal - Yes")
58
COST RISK PROFILE Probabilistic Range of Option 0 Cost Cumulative Probability (%) NPV - $M 0 0.1 0.2 0.3 0.4 0.5 0.6 0.7 0.8 0.9 1 4755005250550575600625650675700725750775800825 Base Case = $626M 90th Percentile = $742M Expected Value = $640M10th Percentile = $553M
 NPV - $M Base Case = $626M 90th Percentile = $742M Expected Value = $640M10th Percentile = $553M")
59
“Tornado” Diagram Relative Impact of Uncertainties: Option 11 NPV - $M A Tornado Diagram evaluates the impact of each uncertainty by varying it from its best to worst state, while fixing all other uncertainties to their base (most likely) state. The width of the bar shows the impact on total option cost. Growth in City Waste Stream Construction Costs Res/ Com Recycling Rate Rail Price KC Rail Participation Disposal Savings Recycling Revenues Labor Efficiency Factor KC Disposal Participation 620640660680700720740

60
BASE CASE TORNADO DIAGRAM Relative Impact of Uncertainties Option 1 NPV - $M Growth in City Waste Stream Res/ Com Recycling Rate Construction Costs Labor Efficiency Factor Recycling Revenues 440460480500520540560580600 Risk Assessment Results

61
Impact of Key Uncertainties ($M) Values shown reflect the impact on total cost when an uncertainty is varied across its range of outcomes. All other uncertainties are held constant at their base states.

62
Conclusions Non-intermodal options (0 and 8) have the greatest cost uncertainty (high spread between their 10th and 90th percentiles). Growth in the city’s waste stream and recycling rate changes have the greatest impact on total costs. Intermodal options are much less sensitive to variations in city waste and recycling growth rates. Construction cost uncertainty is lowest with Options 0 and 8. In all options, the expected value of costs is 5-7 percent greater than our baseline cost estimates. This means that there is more upside risk than downside opportunity in the estimates.

63
What We Learned Round 1 The cost of reuse/recycling facilities is relatively high compared to percent diverted Building costs are high at SRDS and intermodal due to soils Queue reduction goal was too aggressive; resulted in too large a facility Don’t need to purchase property to take advantage of partner tons

64
Round 2 Revised Options Modifications to Recycling facilities to increase cost effectiveness Less aggressive queue reduction goal Alternative construction that does not require pilings at SRDS

65
Project Status Approach and results accepted by SPU Asset Management Committee AMC asked us to quantify in $’s some of the benefits from value model Plan supported by SPU Director and Mayor Site for IM announced, property purchases beginning or underway for all 3 site Decision to do a DBO for IM

66
Concluding Remarks Decisions are likely to be supported if: –They are rational and compelling –The underlying trade-offs have been clearly communicated –Discussions and decisions have been documented for later reference and defensibility –Conflicts have been anticipated, and thus prevented or well-managed –Participants feel they have been listened to and that they have had some impact or effect on the final outcome No tool replaces human judgment

67
Brief Advertisement It’s Not Garbage Anymore! New 60% City Programs include: –ban on recyclables –commercial collection of food waste –residential collection of food waste with yard waste

Similar presentations