Download presentation
Presentation is loading. Please wait.

1
2012 National PBIS Leadership Forum Hyatt Regency O’Hare Rosemont Illinois Assessing the Impact of PBIS on Students with IEPs Session B7 | October 18, 2012 | 11:30am – 12:45 pm Lucille Eber, Illinois PBIS Network Nanci Johnson, University of Missouri Tary Tobin, University of Oregon

2
Putting outcomes for students with IEP’s ALL into the context of schools as systems to educate and support ALL students.

3
Primary Prevention: School-/Classroom- Wide Systems for All Students, Staff, & Settings Secondary Prevention: Specialized Group Systems for Students with At-Risk Behavior Tertiary Prevention: Specialized Individualized Systems for Students with High-Risk Behavior 80% of Students 15% 5% SCHOOL-WIDE POSITIVE BEHAVIOR INTERVENTIONS and SUPPORT

4
Educational Outcomes for Youth with Emotional & Behavioral Disabilities 40%-60% drop out of high school (Wagner, 1991; Wehman, 1996; Wagner, Kutash, Duchnowski, & Epstein, 2005) Experience poorer academic performance than students with LD (Lane, Carter, Pierson & Glaeser, 2006) 10%-25% enroll in post-secondary education (compared to 53% of typical population) (Bullis & Cheney, 1999) High rates of unemployment/underemployment post- school (Bullis& Cheney, 1999; Kortering, Hess & Braziel, 1996; Wagner, 1991; Wehman, 1996) High rates of MH challnges, poverty, incarceration (Alexander, et al., 1997; Kortering, et. al., 1998; Lee and Burkham, 1992; Wagner, 1992)
.")
5
Youth with EBD…. Disengaged from school/family/ community Most likely disability group to be in a segregated academic setting Highest rates of disciplinary infractions Perceived by teachers as having significantly lower levels of social competence and school adjustment (Lane, Carter, Pierson, & Glaeser, 2006)
.")
6
Students with Individualized Education Programs and Involvement in Office Discipline Referrals Tary Jeanne Tobin University of Oregon

7
NATIONAL DATA

8
What do we know about school discipline referrals and special education students? Students with disabilities tend to be over- represented in school discipline (Cooley, 1995; Fabelo et al., 2011; Krezmien, Leone, & Achilles, 2006; Rausch & Skiba, 2006; SRI International, 2006; Zhang, Katsiyannis, & Herbst, 2004).
..")
9
Could PBIS help? With Positive Behavioral Interventions and Supports (PBIS, Horner et al., 2009; Sailor, Dunlap, Sugai, & Horner, 2009; Sugai & Horner, 2010), many schools have been able to reduce rates of discipline referrals for the school as a whole (Bradshaw, Debnam, Koth, & Leaf, 2009; Simenson et al., 2012).
, many schools have been able to reduce rates of discipline referrals for the school as a whole (Bradshaw, Debnam, Koth, & Leaf, 2009; Simenson et al., 2012)..")
10
Does PBIS help students with disabilities? “If schools are able to reduce discipline referral rates for major offences for the school as a whole, will the number of students in special education (i.e., students with an IEP) who receive discipline referrals be reduced?”
 who receive discipline referrals be reduced .")
11
SWIS Records from Schools across the Nation Studied The School Wide Information System (SWIS, May et al., 2006; see http://www.swis.org). SWIS often is used for decision-making with PBIS (Tobin, 2006). http://www.swis.org
.")
12
Criteria SWIS data for 3 years: 2008-2009, 2009- 2010, and 2010-2011 At least a 10% decrease in rate of major ODRs from the first to the last year At least 5% of the students in their SWIS data had an IEP Not an alternative or juvenile justice school Entered their enrollment and number of school days

13
Total Number of All Students with ODRs for All Schools (N = 85) Meeting Criteria
 Meeting Criteria")
14
Total Number of Students with ODRs and IEPs

15
Main Point of National Data Study If schools use PBIS and reduce their rates of major ODRs for the school as a whole, the number of students with disabilities who receive ODRs also will be reduced.

16
ILLINOIS DATA

17
Why Illinois? More schools using PBIS than any other state More schools meeting the national study criteria than any other state Information on (a) the total number of students with IEPs in each school and (b) the year when the school first started to use PBIS in formats that could be combined with SWIS data
 the total number of students with IEPs in each school and (b) the year when the school first started to use PBIS in formats that could be combined with SWIS data.")
18
Information about Each School included the Illinois Study Number of major ODRs for two school years, 2009-2010 and 2010-2011 Total number of students in the school with an IEP Not just those who also had an ODR.

19
Total Number of All Students with ODRs in Illinois Schools with Reduced Rates

20
Total Number of Students with ODR and IEP in Illinois Schools with Reduced Rates

21
Research Question and Answer for Illinois “If schools were able to reduce discipline referral rates for major offences for the school as a whole, was the number of students in special education (i.e., students with an IEP) who received discipline referrals reduced?” Answer: Yes.
 who received discipline referrals reduced Answer: Yes.")
22
Average Percent of Students With and Without ODRs 2009-11 (N=361 schools) Percentage of Students
 Percentage of Students")
23
Alton CUSD 11 Succeeds in Educating More Students with IEPs in General Education

24
Alton CUSD 11 Decreases Reliance on Self Contained Special Education Placements

25
Alton Middle School, Alton CUSD 11, SPP Data Demonstrates Access to General Education Settings for Students with IEPs

26
Replication District CUSD 300 Starts to Turn Curve of SPP Indicators in Desired Direction

27
OSS for Illinois High School Students with RENEW Plans (N=39 Students) Number of OSS and ODRs
 Number of OSS and ODRs")
28
Alton High School Student ODRs and GPA During RENEW (N=3 Students) Number of ODRs GPA (4.0 = A)
 Number of ODRs GPA (4.0 = A)")
29
Student’s Behavior Improvement with RENEW Number of ODRs and OSS

30
Student’s Improved Behavioral and Academic Outcomes 4=High Risk;1=Low Risk4=Always; 1=Never

31
IL PBIS Number of Schools Applying for Recognition & Percentage of Implementing Schools that Applied 4=Always; 1=Never District Invests in Tier 3 Coaching Improved Outcomes for Students with IEPs

32
Students with IEPs Benefit Equally from PBIS IL PBIS Number of Schools Applying for Recognition & Percentage of Implementing Schools that Applied Percentage of ODRs

33
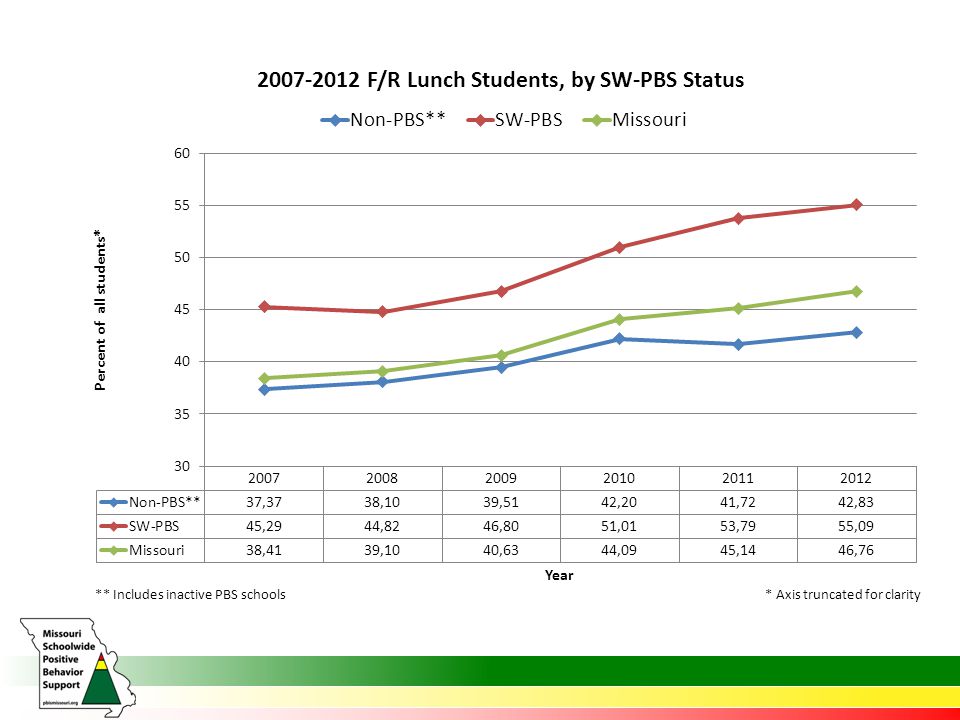
Missouri Schoolwide Positive Behavior Support Contextual Information: Student Demographics School Implementation Levels

38
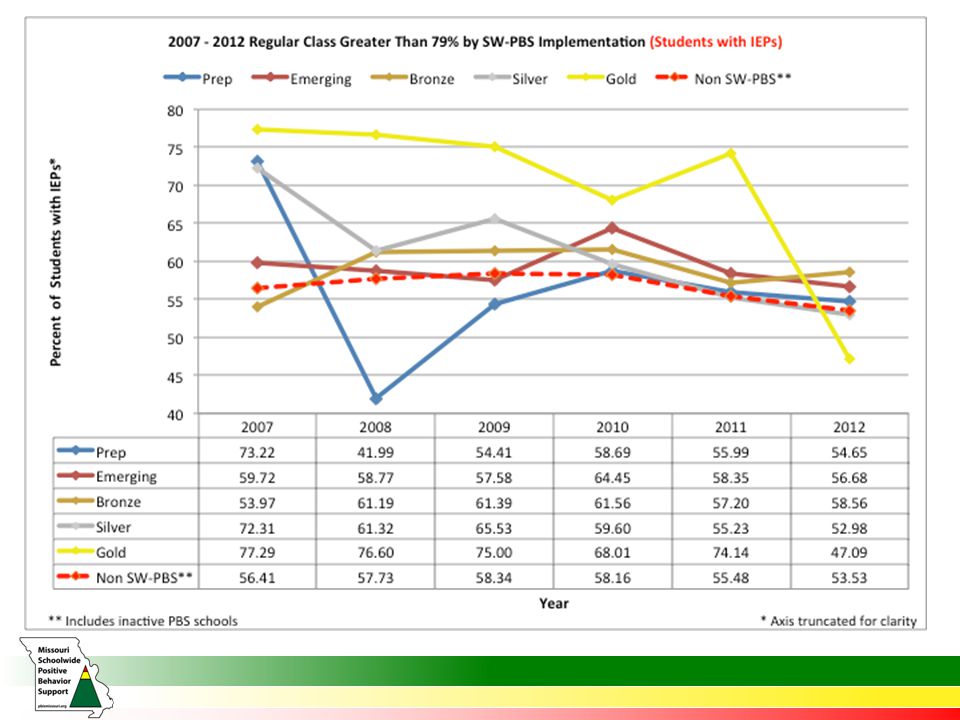
MO SW-PBS Implementation and Outcomes for Students with IEPs Attendance Regular Class Placement Greater than 79%

42
Attendance & Placement Students with IEPs in MO SW-PBS schools implementing with fidelity across tiers of support have attendance as good if not better than those of ALL Missouri schools or Non-SW-PBS schools Students with IEPs in MO SW-PBS schools implementing with fidelity across tiers of support have Regular Education placement at greater than 79% is in most cases equal to or greater than Non-SW-PBS schools

43
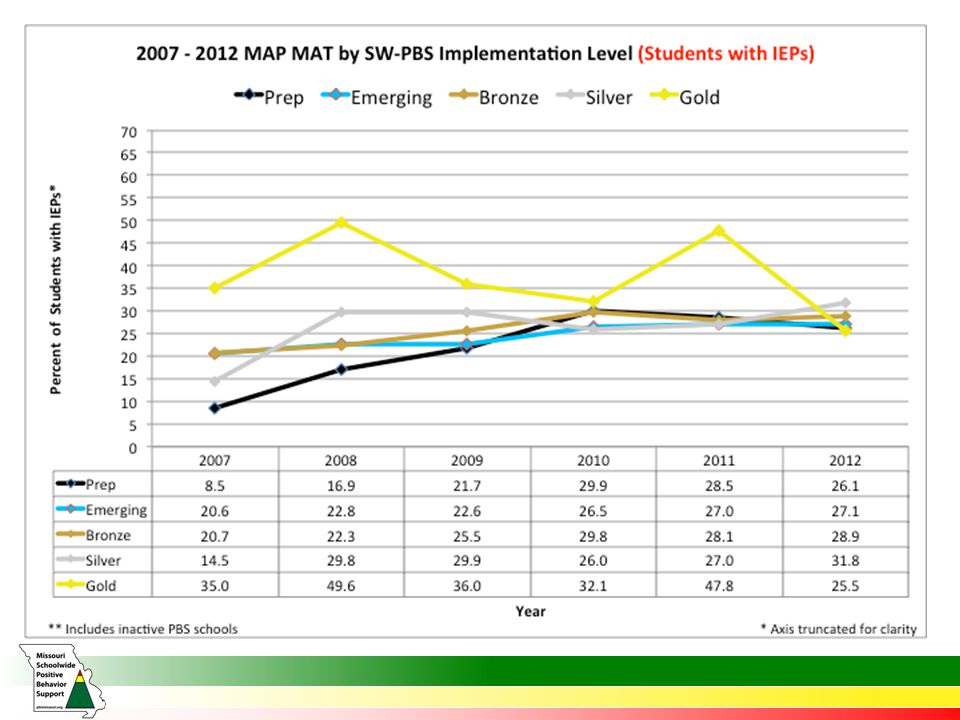
MO SW-PBS Implementation and Outcomes for Students with IEPs Missouri Assessment Program (MAP) – Communication Arts – Math
 – Communication Arts – Math")
47
“MAP” Communication Arts & Math Trends for Students with IEPs in MO SW- PBS schools on the Missouri Assessment Program (MAP) year end tests show improvements over time by levels of implementation/recognition across both Communication Arts and Math.
 year end tests show improvements over time by levels of implementation/recognition across both Communication Arts and Math.")
Similar presentations


>")


