Download presentation
Presentation is loading. Please wait.

1
Explaining the Use of Graphs in Corporate Takeovers by K A Houghton The Australian National University University of Texas at Austin and S Smith University of Melbourne Acknowledgement: The assistance of Dr Elizabeth Roberts and Christine Jubb is gratefully acknowledged

2
1.0Introduction Graphs are not uncommon in financial reports. By contrast with the conventional information in such reports little is known about their usage. For reasons discussed below the setting chosen is corporate takeovers. Interesting setting given: Generality of economic substance Incentives of the sender of information is predictable (or at least inferable)
.")
3
2.0 Background 2.1Use and Regulation of Graphs “Common” way to illustrate corporate performance (Beattie and Jones, 1996) Graphs are voluntary (with minor exceptions) Graphs are regulated in that information must not be “materially misleading” or inconsistent with underlying accounting information
 Graphs are voluntary (with minor exceptions) Graphs are regulated in that information must not be materially misleading or inconsistent with underlying accounting information")
4
2.2Impression Management Graphs can be considered from an “Impression Management” theory perspective Hopwood (1996) suggests that there is need to examine the type and method by which information is conveyed 2.3 Literature on Graphs While there is literature on graphical (and similar presentations) of information it is modest in size and quality Tends to be descriptive
 suggests that there is need to examine the type and method by which information is conveyed 2.3 Literature on Graphs While there is literature on graphical (and similar presentations) of information it is modest in size and quality Tends to be descriptive")
5
3.0 Research Setting Takeovers: Economically significant Tends to be less passive than annual reports Have multiple sources of information (“bidder”-“target”) Defined as an event where one company (bidder) attempts to acquire the shares of another (target) to gain a material equity interest Of interest as you can have “friendly” (target board approves) and “hostile” (target board no approval) No known study of this type (takeover)
 Defined as an event where one company (bidder) attempts to acquire the shares of another (target) to gain a material equity interest Of interest as you can have friendly (target board approves) and hostile (target board no approval) No known study of this type (takeover)")
6
4.0Underpinning Theory Graphs provide no new information and must be consistent with existing disclosed data Signalling theory (Penman, 1980; Dye, 1985, 1986) and others would predict that sender of signals will highlight or emphasise “good” news or distinguish superior performance from others
 and others would predict that sender of signals will highlight or emphasise good news or distinguish superior performance from others")
7
5.0Presence and Extent of Graph Usage in Takeover Documents We predict that factors relating to: (1)company characteristics (2) adversarial conflict will influence the presence and extent of usage of graphs.
company characteristics (2) adversarial conflict will influence the presence and extent of usage of graphs.")
8
6.0 Company Characteristics Profitability Those with higher profits will be more likely to highlight their company through use of graphs (supported by Beattie and Jones, 1992, 1994 and others) Stockholder dispersion Companies with disperse stockholder will have less “sophisticated” users on average and will have more extensive use of graphs Takeover Value More economically substantive the takeover the greater the use of graphs
 Stockholder dispersion Companies with disperse stockholder will have less sophisticated users on average and will have more extensive use of graphs Takeover Value More economically substantive the takeover the greater the use of graphs")
9
7.0Research Method Archival using takeovers Takeovers excluded (majority) Share repurchase Share buyback Changes to related companies Takeover of proprietary (private) companies Takeover bids quickly abandoned (no lodgement of both sets of documents) 62 remained
 Share repurchase Share buyback Changes to related companies Takeover of proprietary (private) companies Takeover bids quickly abandoned (no lodgement of both sets of documents) 62 remained")
10
8.0Variable Measurement 8.1 Dependent Variables Presence / absence of graphs coded 0/1 Number of graphs count of the number of graphs

11
8.0Variable Measurement (continued) 8.2 Independent Variables Takeover type Target management’s accept / reject bid Role in takeover Offer documents - bidder Reply document - target Takeover value Initial bid price Shareholder dispersion Herfindal index Profitability Net profit before interest & tax (positive or negative)
 8.2 Independent Variables Takeover type Target management’s accept / reject bid Role in takeover Offer documents - bidder Reply document - target Takeover value Initial bid price Shareholder dispersion Herfindal index Profitability Net profit before interest & tax (positive or negative)")
12
9.0 Results – Descriptive 62 takeovers 124 documents 24% contained graphs 85% of graphs related to profitable targets 67% of all graphs were by targets 53% of these were in hostile takeovers Mostly small takeovers Graph type (bar graphs 46% line graphs 34%)
")
13
10.0 Results - Hypotheses 10.1Basic test of coy characteristics adversarial conflict Presence / Absence of Graphs

14
10.2Extent of Usage

15
11.0Discussion Generally “extent” tests stronger power Main effects of company characteristics and adversarial conflict Significant variables: Hostile/friendly Bidder/target Target profitability Takeover value

16
12.0 Limitations Takeover included (62) of wider population One time period One location ( with particular regulatory environment) Only minority of documents had graphs Only formal documents No base level of presentation culture No assessment of who used graphs first
 of wider population One time period One location ( with particular regulatory environment) Only minority of documents had graphs Only formal documents No base level of presentation culture No assessment of who used graphs first")
17
13.0 Conclusion Graphs are not “random” or “neutral” inclusions in the communication process to stockholders. Still more is needed to understand how graphs are used and if and how they may by “biased” in terms of presentation.

18
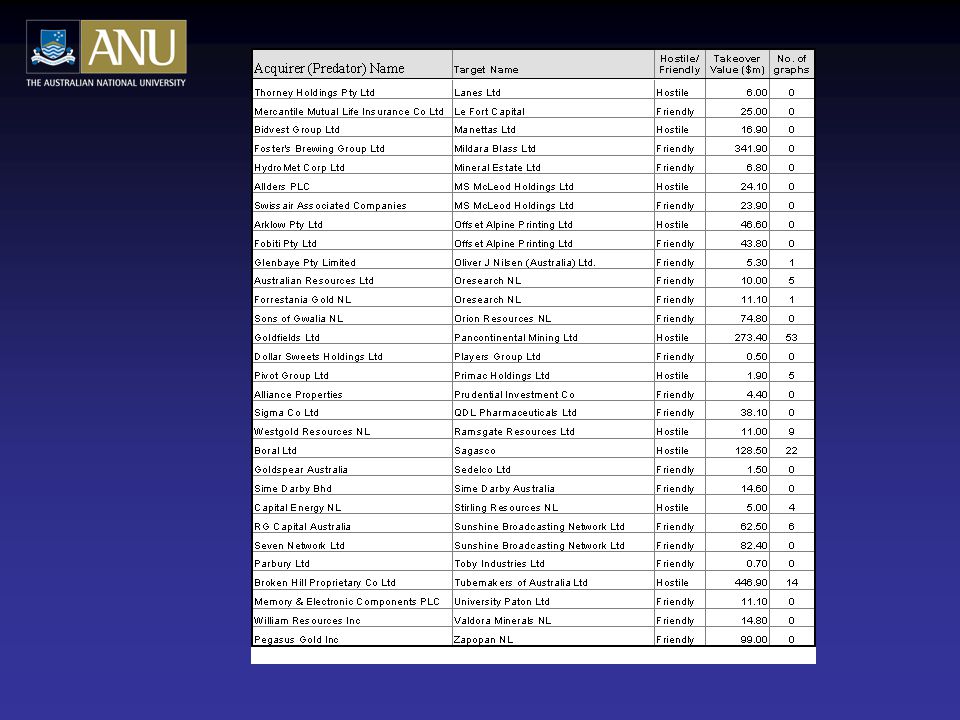
Appendix A List of Companies

Similar presentations


, Shaun Bond (University of Cincinnati), & Joseph Ooi (National University of Singapore)>")


>")


 - more dividends more value. Follows from.>")


 Dolly King (UNC Charlotte) NTU, 12/10/2010.>")

 Different in German and UK Companies? Marc Goergen University of Manchester Institute of Science & Technology.>")