Download presentation
Presentation is loading. Please wait.

1
accountability preview Major Mindshift Out with the Old – In with the New TEPSA - May 2013 (Part 2) Ervin Knezek ervin@lead4ward.com John Fessenden john@lead4ward.com
 Ervin Knezek John Fessenden")
3
accountability preview 2-part Webinar Series May 10, 2013 – Part 1 System Overview Index 1 – Student Achievement Index 3 – Closing Performance Gaps May 17, 2013 – Part 2 Index 2 – Student Progress Index 4 – Postsecondary Readiness Not applicable in 2013 to districts/campuses with a high grade of Grade 8 or lower Ratings and Ramifications

4
goals Construction Of indices What measures are included? How? Clarity Of calculation... and application Connection To instruction

5
the vibe

6
a few points to clarify Let’s take one step at a time... New accountability system is dramatically different Step 1 – learn the 2013 system Timeline – NOW! Step 2 – learn the changes/additions for 2014 Timeline – Summer and Fall 2013 Focus first on system for traditional districts and campuses Cover alternative education modifications separately

7
2013 Accountability...

8
Overall Design Four Performance Indexes Meets 4 statutory goals 1.Improving student achievement at all levels in core subjects 2.Ensuring progress of all students toward Advanced Academic Performance (STAAR Level III) 3.Closing Advanced Academic Performance Gaps among groups 4.Closing gaps among groups in % of students graduating under Recommended or Advanced high school programs p. 3

9
2013 Accountability Achievement All Students Only Single percentage combined over ALL Subject Areas ≥ Level II (Phase 1) STAAR ≥ Met Std Grade 11 TAKS Progress 10 student groups – All Students – 7 Race/Ethnicity – SWD – ELL Minimum size – 10 for All Students – 25 for other groups By Subject Area – Reading & Math in 2013 Based on GROWTH – 1 point for Met – 2 points for Exceeded Closing Gaps Eco Dis and 2 lowest Race/Ethnicity groups from prior year By Subject Area (all subjects) 1 point for Level II (Phase 1) 2 points for Level III (2014) Postsecondary 4-year or 5-year graduation rate (or Annual Dropout Rate) – 10 student groups % RHSP/DAP – 8 student groups (not SWD or ELL ) STAAR Postsecondary Readiness – Level II Final (2014) Index 1 Student Achievement Index 2 Student Progress Index 3 Closing Performance Gaps Index 4 Postsecondary Readiness Target = 50Target = ≈ 5 th %ile Target = 55Target = 75
 STAAR ≥ Met Std Grade 11 TAKS Progress 10 student groups – All Students – 7 Race/Ethnicity – SWD – ELL Minimum size – 10 for All Students – 25 for other groups By Subject Area – Reading & Math in 2013 Based on GROWTH – 1 point for Met – 2 points for Exceeded Closing Gaps Eco Dis and 2 lowest Race/Ethnicity groups from prior year By Subject Area (all subjects) 1 point for Level II (Phase 1) 2 points for Level III (2014) Postsecondary 4-year or 5-year graduation rate (or Annual Dropout Rate) – 10 student groups % RHSP/DAP – 8 student groups (not SWD or ELL ) STAAR Postsecondary Readiness – Level II Final (2014) Index 1 Student Achievement Index 2 Student Progress Index 3 Closing Performance Gaps Index 4 Postsecondary Readiness Target = 50Target = ≈ 5 th %ile Target = 55Target = 75")
10
2013 Accountability Achievement All Students Only Single percentage combined over ALL Subject Areas ≥ Level II (Phase 1) STAAR ≥ Met Std Grade 11 TAKS Progress 10 student groups – All Students – 7 Race/Ethnicity – SWD – ELL Minimum size – 10 for All Students – 25 for other groups By Subject Area – Reading & Math in 2013 Based on GROWTH – 1 point for Met – 2 points for Exceeded Closing Gaps Eco Dis and 2 lowest Race/Ethnicity groups from prior year By Subject Area (all subjects) 1 point for Level II (Phase 1) 2 points for Level III (2014) Postsecondary 4-year or 5-year graduation rate (or Annual Dropout Rate) – 10 student groups % RHSP/DAP – 8 student groups (not SWD or ELL ) STAAR Postsecondary Readiness – Level II Final (2014) Index 1 Student Achievement Index 2 Student Progress Index 3 Closing Performance Gaps Index 4 Postsecondary Readiness Target = 50Target = ≈ 5 th %ile Target = 55Target = 75 Met Standard Improvement Required
 STAAR ≥ Met Std Grade 11 TAKS Progress 10 student groups – All Students – 7 Race/Ethnicity – SWD – ELL Minimum size – 10 for All Students – 25 for other groups By Subject Area – Reading & Math in 2013 Based on GROWTH – 1 point for Met – 2 points for Exceeded Closing Gaps Eco Dis and 2 lowest Race/Ethnicity groups from prior year By Subject Area (all subjects) 1 point for Level II (Phase 1) 2 points for Level III (2014) Postsecondary 4-year or 5-year graduation rate (or Annual Dropout Rate) – 10 student groups % RHSP/DAP – 8 student groups (not SWD or ELL ) STAAR Postsecondary Readiness – Level II Final (2014) Index 1 Student Achievement Index 2 Student Progress Index 3 Closing Performance Gaps Index 4 Postsecondary Readiness Target = 50Target = ≈ 5 th %ile Target = 55Target = 75 Met Standard Improvement Required")
11
The way we use words... 1.Passing Standard... do they mean what we think they mean? – Level of performance necessary to “pass” the test – Expressed as raw score on classroom assignments – Expressed as a scale score on standardized assessments – Raw score likely to vary year-to-year – % of students meeting the Passing Standard – % meeting Level II – % meeting Level III – Accountability targets – Pass rate necessary to achieve a particular rating 2.Pass Rate 3.Pass Rate Standard p. 1

12
2013 Accountability Achievement All Students Only Single percentage combined over ALL Subject Areas ≥ Level II (Phase 1) STAAR ≥ Met Std Grade 11 TAKS Progress 10 student groups – All Students – 7 Race/Ethnicity – SWD – ELL Minimum size – 10 for All Students – 25 for other groups By Subject Area – Reading & Math in 2013 Based on GROWTH – 1 point for Met – 2 points for Exceeded Closing Gaps Eco Dis and 2 lowest Race/Ethnicity groups from prior year By Subject Area (all subjects) 1 point for Level II (Phase 1) 2 points for Level III (2014) Postsecondary 4-year or 5-year graduation rate (or Annual Dropout Rate) – 10 student groups % RHSP/DAP – 8 student groups (not SWD or ELL ) STAAR Postsecondary Readiness – Level II Final (2014) Index 1 Student Achievement Index 2 Student Progress Index 3 Closing Performance Gaps Index 4 Postsecondary Readiness Target = 50Target = ≈ 5 th %ile Target = 55Target = 75 Met Standard Improvement Required Passing Standard Pass Rate Pass Rate Standard
 STAAR ≥ Met Std Grade 11 TAKS Progress 10 student groups – All Students – 7 Race/Ethnicity – SWD – ELL Minimum size – 10 for All Students – 25 for other groups By Subject Area – Reading & Math in 2013 Based on GROWTH – 1 point for Met – 2 points for Exceeded Closing Gaps Eco Dis and 2 lowest Race/Ethnicity groups from prior year By Subject Area (all subjects) 1 point for Level II (Phase 1) 2 points for Level III (2014) Postsecondary 4-year or 5-year graduation rate (or Annual Dropout Rate) – 10 student groups % RHSP/DAP – 8 student groups (not SWD or ELL ) STAAR Postsecondary Readiness – Level II Final (2014) Index 1 Student Achievement Index 2 Student Progress Index 3 Closing Performance Gaps Index 4 Postsecondary Readiness Target = 50Target = ≈ 5 th %ile Target = 55Target = 75 Met Standard Improvement Required Passing Standard Pass Rate Pass Rate Standard")
13
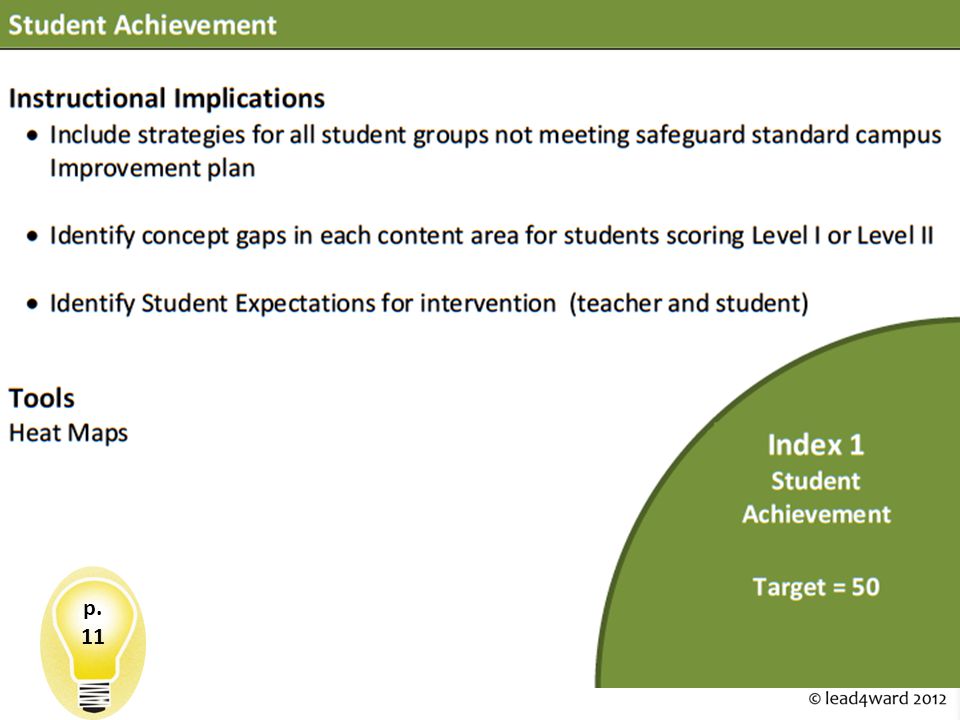
Index 1 Student Achievement Index 1 Student Achievement p. 3

14
Index 1: Student Achievement Snapshot of satisfactory student performance across all subjects for all students Index = % of students passing state assessment Includes all subjects tested at the campus/district Reading, Math, Writing, Science and Social Studies Overall passing rate of students across all subjects tested (NOT the % of students passing all tests) Index 1 Student Achievement
 Index 1 Student Achievement")
15
Index 1: Student Achievement Tests included STAAR Grades 3-8 and EOCs Versions: STAAR, STAAR Spanish, STAAR Modified, STAAR Alternate Passing = Level II – Phase 1 TAKS Exit Level Grade 11 Passing = Met Standard (2100 points) Excludes ELL students in first 3 years in U.S. schools (5 years for asylees/refugees) Index 1 Student Achievement
 Index 1 Student Achievement.")
16
Index 1: Student Achievement Test administrations included STAAR Grades 3-8 and Exit Level TAKS Spring 2013 (accountability subset based on fall 2012) STAAR EOCs Spring 2013 (accountability subset based on fall 2012) December 2012 (accountability subset based on fall 2012) July 2012 (accountability subset based on fall 2011) Retest results Grades 5 & 8 – Best result from first 2 administrations EOCs – Best result from 3 test administrations Index 1 Student Achievement
 STAAR EOCs Spring 2013 (accountability subset based on fall 2012) December 2012 (accountability subset based on fall 2012) July 2012 (accountability subset based on fall 2011) Retest results Grades 5 & 8 – Best result from first 2 administrations EOCs – Best result from 3 test administrations Index 1 Student Achievement")
17
Index 1: Student Achievement 3 administrations of EOCs? Index 1 Student Achievement Algebra I EOC - Met Level II - Phase 1? StudentJuly 2012December 2012May 2013"Best Result" 1No 2 Yes 3No 4Yes 5No 6Yes 7 8 No 9 10 Yes # Met Level II5 # Took10 % Met Level II50%

18
Index 1: Student Achievement 3 administrations of EOCs? Index 1 Student Achievement Algebra I EOC - Met Level II - Phase 1? StudentJuly 2012December 2012May 2013"Best Result" 1No 2 Yes 3No 4Yes 5No 6Yes 7 8 No 9 10 Yes # Met Level II5 # Taken10 % Met Level II50% Algebra I EOC was taken 17 times by these 10 students BUT each student ONLY generates ONE “test taken” for Algebra I # Met Level II = 5 # Tests Taken = 10

19
Index 1: Student Achievement Student groups evaluated “All Students” No minimum size criteria (small numbers analysis if <10) Other student groups reported (if ≥ 25 students in the group) 7 Race/Ethnicity Groups Economically Disadvantaged ELL Special Education Index 1 Student Achievement
 Other student groups reported (if ≥ 25 students in the group) 7 Race/Ethnicity Groups Economically Disadvantaged ELL Special Education Index 1 Student Achievement")
20
Index 1: Student Achievement System Safeguards District/Campus must address in its improvement plan Performance Rate below 50% in any subject area for any student group meeting minimum size criteria (25 students) Participation Rate below 95% in any subject area for any student group meeting minimum size criteria (25 students) Exceeding 1% and 2% caps for the All Students group at the district level Index 1 Student Achievement p. 4

21
Evaluated p. 5

23
p. 11

26
Index 3 Closing Performance Gaps Index 3 Closing Performance Gaps p. 3

27
Index 3: Closing Performance Gaps Emphasizes Advanced Academic Performance (STAAR Level III) for the following student groups Economically Disadvantaged 2 Lowest Performing Race/Ethnicity groups from prior year BUT... Level III cannot be included in accountability until 2014, so... For 2013 Index 3 = % of students in Performance Gap Groups “passing” state assessment Passing STAAR = Level II – Phase 1 Index 3 Closing Performance Gaps

28
Index 3: Closing Performance Gaps All subject areas (each evaluated separately) Reading, Math, Writing, Science, Social Studies Tests included STAAR Grades 3-8 and EOCs Versions: STAAR, STAAR Spanish, STAAR Modified, STAAR Alternate Passing = Level II – Phase 1 TAKS Exit Level Grade 11 Passing = Met Standard (2100 points) Excludes ALL ELL students Index 3 Closing Performance Gaps
 Reading, Math, Writing, Science, Social Studies Tests included STAAR Grades 3-8 and EOCs Versions: STAAR, STAAR Spanish, STAAR Modified, STAAR Alternate Passing = Level II – Phase 1 TAKS Exit Level Grade 11 Passing = Met Standard (2100 points) Excludes ALL ELL students Index 3 Closing Performance Gaps")
29
Index 3: Closing Performance Gaps Tests administrations included STAAR Grades 3-8 and Exit Level TAKS Spring 2013 STAAR EOCs Spring 2013 December 2012 July 2012 Retest results Grades 5 & 8 – Best result from first 2 administrations EOCs – Best result from 3 test administrations Index 3 Closing Performance Gaps

30
Index 3: Closing Performance Gaps Student groups evaluated Economically Disadvantaged (no Minimum Size Criteria) 2 lowest performing Race/Ethnicity groups meeting Minimum Size Criteria (25 students) from Index 1 in 2012 The 2 Performance Gap Groups are determined based on combined performance across all subjects – so the Performance Gap Groups evaluated in 2013 are the same in all subjects If a 2013 Performance Gap Group does not meet Minimum Size Criteria in a subject area, then it is not evaluated in that subject area Index 3 Closing Performance Gaps
 2 lowest performing Race/Ethnicity groups meeting Minimum Size Criteria (25 students) from Index 1 in 2012 The 2 Performance Gap Groups are determined based on combined performance across all subjects – so the Performance Gap Groups evaluated in 2013 are the same in all subjects If a 2013 Performance Gap Group does not meet Minimum Size Criteria in a subject area, then it is not evaluated in that subject area Index 3 Closing Performance Gaps")
31
Up to 3 student groups evaluated in each subject area Economically Disadvantaged (no Minimum Size Criteria) 2 lowest performing Race/Ethnicity groups meeting Minimum Size Criteria (25 students) from Index 1 in 2012 Index 3 Closing Performance Gaps p. 8

32
Let’s look at Reading and start with EcoDis 380 students took the test 233 passed Some at Level II Some at Level III 61% passed 1 point for each %age point of Pass Rate Maximum Points Possible = 100 Index 3 Closing Performance Gaps

33
Let’s look at Reading and start with EcoDis 380 students took the test 233 passed Some at Level II Some at Level III 61% passed 1 point for each %age point of Pass Rate Maximum Points Possible = 100 Index 3 Closing Performance Gaps

34
For each subject area Add up the number of points for the Performance Gap Groups Add up the Maximum Number of Points for the subject area In this example, neither Performance Gap Group meets Minimum Size Criteria (25 students) in Writing or Science So in those subject areas, ONLY the EcoDis group is evaluated Index 3 Closing Performance Gaps
 in Writing or Science So in those subject areas, ONLY the EcoDis group is evaluated Index 3 Closing Performance Gaps")
35
The Index 3 Score is determined by: Adding up the Total Points for each subject area Adding up the Maximum Points Possible for each subject area Dividing the Total Points earned by the Maximum Points Possible Index 3 Closing Performance Gaps

37
p. 11

39
Quintiles and Common Sense by Student Group

40
p. 3 Index 2 Student Progress Index 2 Student Progress

41
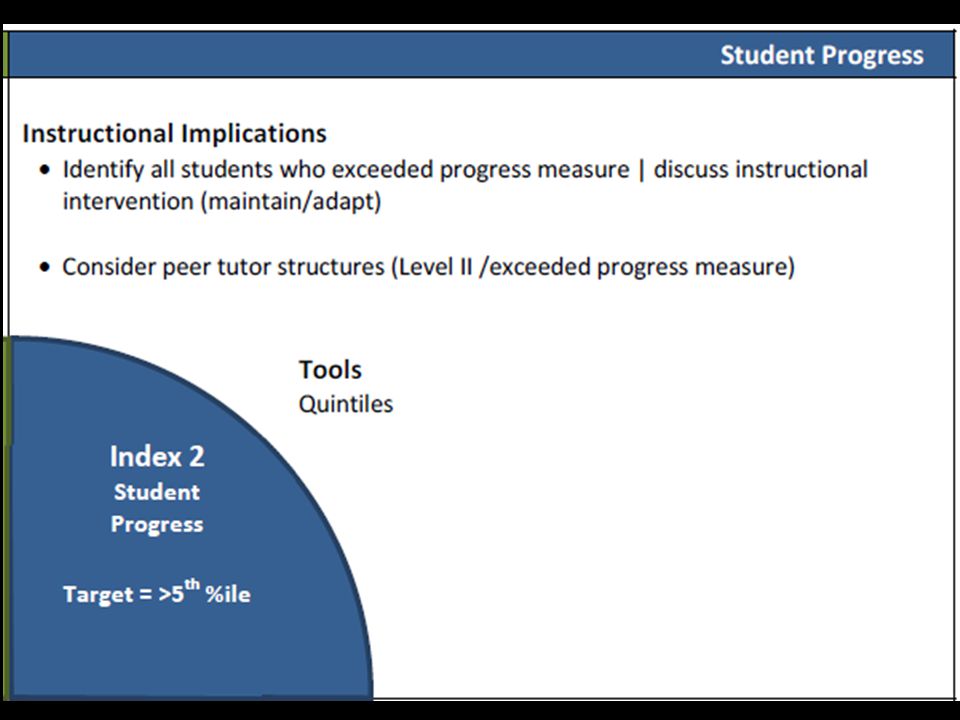
Index 2: Student Progress Focuses on actual student growth independent of the student’s achievement level (Level I, Level II, Level III) Each student is assigned a growth category based on the change in his/her scale score in relation to growth expectations Did Not Meet Met Exceeded Subject areas evaluated for 2013 Reading (Grade 4 to English II – Reading) Math (Grade 4 to Algebra I) Writing (English I-Writing to English II-Writing) Index 2 Student Progress p. 3

42
Tests included STAAR Grades 4-8 and EOCs Versions: STAAR, STAAR Spanish, STAAR Modified, STAAR Alternate Excludes all ELL students EXCEPT ELL students in U.S. schools for more than 3 years (5 years for asylees/refugees) taking STAAR Spanish Index 2: Student Progress Index 2 Student Progress
 taking STAAR Spanish Index 2: Student Progress Index 2 Student Progress.")
43
Tests administrations included STAAR Grades 4-8 Spring 2013 STAAR EOCs Spring 2013 December 2012 July 2012 Retest results Grades 5 & 8 – Best result from first 2 administrations EOCs – Best result from 3 test administrations Index 2: Student Progress Index 2 Student Progress

44
Student groups Only evaluated if group size ≥ minimum size criteria (MSC) Index 2: Student Progress Index 2 Student Progress Student Group Minimum Size Criteria 1All Students10 2African American 25 3American Indian 4Asian 5Hispanic 6Pacific Islander 7White 82 or More Races 9Special Education 10ELL
 Index 2: Student Progress Index 2 Student Progress Student Group Minimum Size Criteria 1All Students10 2African American 25 3American Indian 4Asian 5Hispanic 6Pacific Islander 7White 82 or More Races 9Special Education 10ELL")
45
Methodology (in each subject area, then cumulated to a single measure) Numerator = # of points based on % of students who Met or Exceeded Growth 1 point for Met 2 points for Exceeded Denominator = Maximum Points Possible based on number of student groups meeting minimum size criteria Maximum Points Possible = 200 points for each evaluated student group Index 2: Student Progress Index 2 Student Progress
 Numerator = # of points based on % of students who Met or Exceeded Growth 1 point for Met 2 points for Exceeded Denominator = Maximum Points Possible based on number of student groups meeting minimum size criteria Maximum Points Possible = 200 points for each evaluated student group Index 2: Student Progress Index 2 Student Progress")
46
For each student group determine % Met Progress % Exceeded Progress % Met or Exceeded Progress Identify student groups that meet Minimum Size Criteria ≥ 10 for All Students ≥ 25 for all other student groups p. 6

47
For each evaluated student group Assign 1 point for each % who Met or Exceeded Progress Assign 1 point for each % who Exceeded Progress Add points together Note Maximum Possible Points for each evaluated student group = 200 p. 7

48
For each subject area Add the Weighted Progress Points for each evaluated student group Add the Maximum Possible Points for each evaluated student group p. 7 Index Score (Add Reading + Math)
.")
50
p. 11

52
p. 3 Index 4 Postsecondary Readiness Index 4 Postsecondary Readiness

53
p. 3 Index 4 Postsecondary Readiness Index 4: Postsecondary Readiness For 2013 Accountability, Index 4 is based on Graduation Rate and RHSP/DAP Diploma Rate Graduation Rate (whichever contributes the higher number of points to the Index) 4-year rate for Class of 2012 Cohort, OR 5-year rate for Class of 2011 Cohort For high schools without a Graduation Rate, the Grade 9-12 Annual Dropout Rate is used
 4-year rate for Class of 2012 Cohort, OR 5-year rate for Class of 2011 Cohort For high schools without a Graduation Rate, the Grade 9-12 Annual Dropout Rate is used.")
54
Graduation Rate Student Groups Only evaluated if number in group ≥ minimum size criteria Index 4 Postsecondary Readiness Index 4: Postsecondary Readiness Student Group Minimum Size Criteria 1All Students0 2African American 25 3American Indian 4Asian 5Hispanic 6Pacific Islander 7White 82 or More Races 9Special Education 10ELL

55
RHSP/DAP Diploma Rate Student Groups Only evaluated if number in group ≥ minimum size criteria Index 4 Postsecondary Readiness Index 4: Postsecondary Readiness Student Group Minimum Size Criteria 1All Students0 2African American 25 3American Indian 4Asian 5Hispanic 6Pacific Islander 7White 82 or More Races

56
Methodology For Graduation Rate Determine 4-year and 5-year graduation rate for each evaluated student group Assign 1 point for each % point Total points for all evaluated student groups Determine which graduation rate contributes more points For RHSP/DAP Diploma Rate Determine rate for each evaluated student group Assign 1 point for each % point Total points for all evaluated student groups Total Points and divide Points Earned by Maximum Possible Points Index 4 Postsecondary Readiness Index 4: Postsecondary Readiness

57
System Safeguards Federal graduation rate targets 78% for 4-year Graduation Rate 83% for 5-year Graduation Rate District/Campus must address performance below target for any evaluated student group in its improvement plan Index 4 Postsecondary Readiness Index 4: Postsecondary Readiness p. 4

58
p. 9

59
p. 10

61
p. 11

63
What did we do? p. 12

64
Distinction Designations Campuses that earn Met Standard are eligible for 3 campus distinction designations: 1.Top 25% Student Progress 2.Academic Achievement Distinction Designation (AADD) in Reading/ELA 3.AADD in Math Top 25% Student Progress Campus must be in top quartile of its campus comparison group on Index 2: Student Progress
 in Reading/ELA 3.AADD in Math Top 25% Student Progress Campus must be in top quartile of its campus comparison group on Index 2: Student Progress")
65
Distinction Designations AADDs recognize outstanding campus achievement in ELA and Math Each campus is compared to its campus comparison group on a number of indicators in ELA and in Math that are specific to its campus type To earn AADD in a subject area, a campus must be in the top quartile of its campus comparison group on the following percentages of the indicators applicable to the campus group type in that subject area: Elementary and Middle Schools: ≥ 50% of the indicators High Schools and K‐12 campuses: ≥ 33% of the indicators

66
Distinction Designations p. 13

67
Thank You!

Similar presentations


 Needs Assessment (Why ) Improvement Plan (How) Implement and Monitor.>")


