Download presentation
Presentation is loading. Please wait.

1
A web-based Biomass Site Assessment Tool Timothy M. Young, PhD – UT Donald G. Hodges, PhD – UT Timothy G. Rials, PhD – UT Robert C. Abt, PhD – NCSU University of Tennessee Southeastern Sun Grant Center Forest Products Center U.S. Forest Service Southern Research Station FIA version 1.0 Beta FIA User Group Meeting and Biomass/Bioenergy Workshop February 23 rd -25 th Houston, TX James H. Perdue – USFS Andy Hartsell – USFS

2
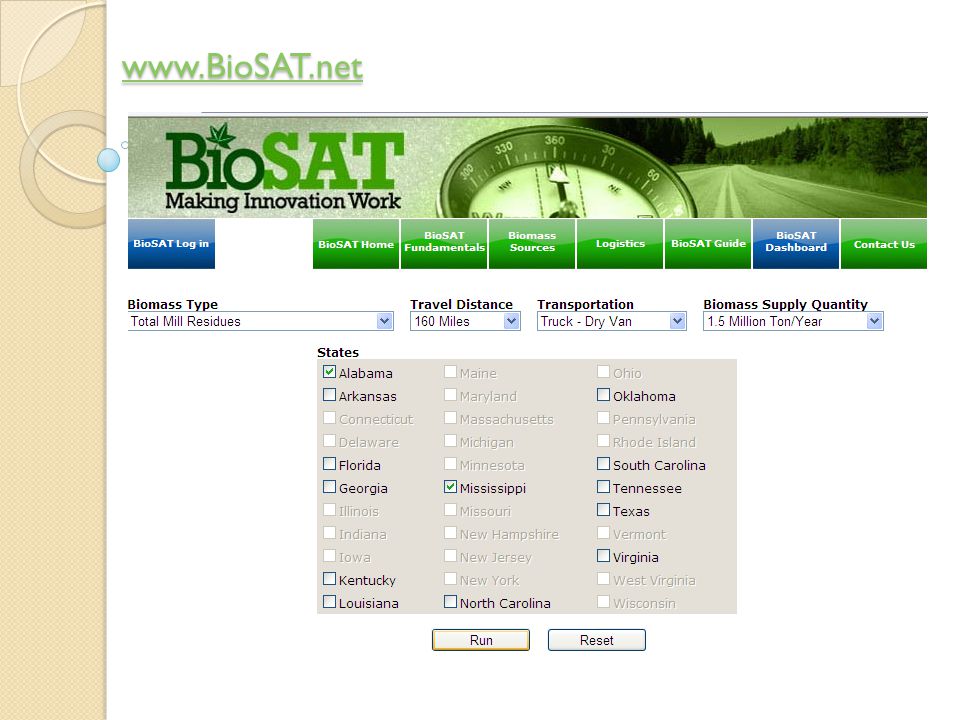
Problem Definition Develop a web-based, economic decision tool for users of cellulose resources with periodic data updates (useful for regional comparisons) Phase I: woody and ag cellulose, geo-referenced MC (supply) curves….also develop a public domain web-site - www.BioSAT.netwww.BioSAT.net Phase II:Bayesian logistic regression models for site selection, market constraints, policy constraints, “some sustainability criteria” Phase III:integration with other modeling efforts
 Phase I: woody and ag cellulose, geo-referenced MC (supply) curves….also develop a public domain web-site - Phase II:Bayesian logistic regression models for site selection, market constraints, policy constraints, some sustainability criteria Phase III:integration with other modeling efforts")
3
Phase I Objectives 1. Develop SQL database of resource data o Mill Residues – FIA Mill Survey Data o Logging Residues – FIA SRTS o Ag Residues – USDA NASS Survey Data o Merchantable – FIA 2. Develop wood resource costs o Timber Mart South o State Price Reports 3. Develop truck transportation cost models 4. Develop harvesting cost models o FRCS - logging residues (Dennis Dykstra) o Tops and limbs at the landing o In-woods non-merchantable biomass o AHA - merchantable wood (Dale Greene)
 o Tops and limbs at the landing o In-woods non-merchantable biomass o AHA - merchantable wood (Dale Greene).")
4
Phase I Objectives 5. Develop web-based system in the public domain (www.BioSAT.net)www.BioSAT.net 6. Update data periodically, e.g., o Diesel prices (US DOE EIA) o Resource costs (TMS, State Reports) o Road network (MapPoint 2006) o Resource data (USFS FIA, SRTS) o etc. Scope: 33 Eastern United States (13 Southern states complete) Resolution: 24,975 Zip Code Tabulation Areas (ZCTA) (9,221 ZCTAs in 13 southern states)
 o Resource costs (TMS, State Reports) o Road network (MapPoint 2006) o Resource data (USFS FIA, SRTS) o etc. Scope: 33 Eastern United States (13 Southern states complete) Resolution: 24,975 Zip Code Tabulation Areas (ZCTA) (9,221 ZCTAs in 13 southern states).")
5
Database Development Forest Cover Data Economic Data Polygon Boundaries (ZCTA) Site Locations SQL Database MC Curve
 Site Locations SQL Database MC Curve")
6
Phase I BioSAT Model USFS FIAUSDA NASS “Woody Residues”“Ag Residues” Mill ResiduesGrowth/Removals Logging Residues SRTS “Econometrics” ZCTA Allocation (GIS) Select Demand Point (or State), Indicate Quantity Demanded Bio-basin Road Networks (MapPoint 2006) Resource Costs (TMS) Harvesting Costs (FRCS) Truck Cost Model Harvesting Costs (Literature) Estimate Total Costs, ATC, MC
 Select Demand Point (or State), Indicate Quantity Demanded Bio-basin Road Networks (MapPoint 2006) Resource Costs (TMS) Harvesting Costs (FRCS) Truck Cost Model Harvesting Costs (Literature) Estimate Total Costs, ATC, MC")
7
o Total Logging Residues o At the landing o In the woods o Total Logging Softwood o At the landing o In the woods o Total Logging Hardwood o At the landing o In the woods o Total Mill Residues o Clean o Unclean o Total Mill Softwood o Clean o Unclean o Total MillHardwood o Clean o Unclean o Barley Straw o Corn Stover o Oat Straw o Sorghum Straw o Wheat Straw (Winter) o Wheat Straw (All) Phase I BioSAT Model (Woody and Ag Cellulose Categories) “Woody Residues”“Ag Residues”
 o Wheat Straw (All) Phase I BioSAT Model (Woody and Ag Cellulose Categories) Woody Residues Ag Residues")
8
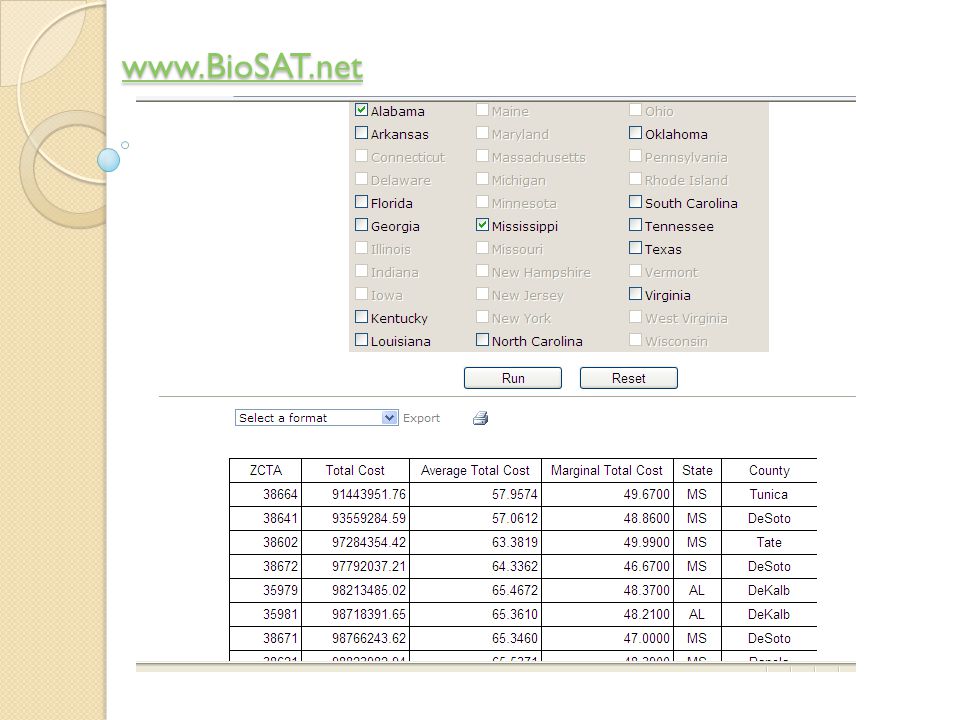
Phase I BioSAT Model – Results (Mill Residues)
")
9
Phase I BioSAT Model – Results (Mill Residues – Low Cost)
")
10
Phase I BioSAT Model – Results (Mill Residues – High Cost)
")
11
1. 38916 (Calhoun Co.) T2. 39094 (Leake Co.) 5. 39476 (Perry Co.) T2. 38879 (Lee Co.) T2. 38864 (Pontotoc Co.) 1. 38916 (Calhoun Co.) T2. 39094 (Leake Co.) 5. 39476 (Perry Co.) T2. 38879 (Lee Co.) T2. 38864 (Pontotoc Co.)
 T (Pontotoc Co.) (Calhoun Co.) T (Leake Co.) (Perry Co.) T (Lee Co.) T (Pontotoc Co.).")
18
Phase I BioSAT Model – Results D

19
D D’

20
Phase I BioSAT Model – Results D D’

21
Phase I BioSAT Model – Results (Low Cost “All” Logging Residues – “at the Landing”) RankZCTACountyStateCity Annual Quantity Available (dry tons)Total Cost Average Total Cost ($/dry ton) Median MC ($/dry ton) 127412GuilfordNCGreensboro502,198$13,599,152$26.93$27.99 238501PutnamTNCookeville511,366$13,719,978$26.94$27.21 327403GuilfordNCGreensboro502,663$13,656,959$26.99$28.02 430604ClarkeGAAthens501,664$13,734,656$27.27$28.33 530602ClarkeGAAthens501,809$13,780,111$27.34$28.92 627498GuilfordNCGreensboro506,446$13,716,390$27.41$27.66 727419GuilfordNCGreensboro500,535$13,755,368$27.45$27.95 830606ClarkeGAAthens500,382$13,782,215$27.52$28.41 937134HumphreysTN New Johnsonville500,063$13,774,854$27.54$29.18 1029471DorchesterSCReevesville507,943$13,800,431$27.59$28.65
 RankZCTACountyStateCity Annual Quantity Available (dry tons)Total Cost Average Total Cost ($/dry ton) Median MC ($/dry ton) GuilfordNCGreensboro502,198$13,599,152$26.93$ PutnamTNCookeville511,366$13,719,978$26.94$ GuilfordNCGreensboro502,663$13,656,959$26.99$ ClarkeGAAthens501,664$13,734,656$27.27$ ClarkeGAAthens501,809$13,780,111$27.34$ GuilfordNCGreensboro506,446$13,716,390$27.41$ GuilfordNCGreensboro500,535$13,755,368$27.45$ ClarkeGAAthens500,382$13,782,215$27.52$ HumphreysTN New Johnsonville500,063$13,774,854$27.54$ DorchesterSCReevesville507,943$13,800,431$27.59$28.65")
22
Phase I BioSAT Model – Results (Low Cost “All” Logging Residues – “in the woods”) RankZCTACountyStateCity Annual Quantity Available (dry tons)Total Cost Average Total Cost ($/dry ton) Median MC ($/dry ton) 131636LowndesGALake Park1,508,464$257,769,437$169.47$168.27 231648EcholsGAStatenville1,503,001$256,495,423$170.22$170.97 331525GlynnGABrunswick1,511,098$260,849,639$173.35$169.54 431631EcholsGAFargo1,543,578$262,612,006$174.22$168.89 531778ThomasGAPavo1,504,400$263,082,933$174.96$170.26 631568CamdenGAWhite Oak1,540,318$270,216,219$175.02$170.29 731331McIntoshGATownsend1,519,054$264,079,498$176.04$175.27 831305McIntoshGADarien1,540,998$267,272,628$177.74$171.77 931537CharltonGAFolkston1,572,056$268,987,024$179.31$169.36 1031404ChathamGASavannah1,527,829$270,658,985$179.79$183.39
 RankZCTACountyStateCity Annual Quantity Available (dry tons)Total Cost Average Total Cost ($/dry ton) Median MC ($/dry ton) LowndesGALake Park1,508,464$257,769,437$169.47$ EcholsGAStatenville1,503,001$256,495,423$170.22$ GlynnGABrunswick1,511,098$260,849,639$173.35$ EcholsGAFargo1,543,578$262,612,006$174.22$ ThomasGAPavo1,504,400$263,082,933$174.96$ CamdenGAWhite Oak1,540,318$270,216,219$175.02$ McIntoshGATownsend1,519,054$264,079,498$176.04$ McIntoshGADarien1,540,998$267,272,628$177.74$ CharltonGAFolkston1,572,056$268,987,024$179.31$ ChathamGASavannah1,527,829$270,658,985$179.79$183.39")
23
Results – Ag Residues (Wheat Straw)
")
24
Results – Ag Residues (Wheat Straw – Low Cost Demand ZCTAs)
")
25
www.BioSAT.net

38
Summary o www.BioSAT.net version 1.0 provides decision tool for identifying least cost woody and ag residues (useful for regional comparisons) www.BioSAT.net o mill residues, logging residues, and ag residues o resource costs, transportation costs, harvesting costs o Validation is on-going o BioSAT (South) – currently in beta-test
 o mill residues, logging residues, and ag residues o resource costs, transportation costs, harvesting costs o Validation is on-going o BioSAT (South) – currently in beta-test")
39
US DOT Southeastern SunGrant Center - Final Report Available

40
Future Research o Merchantable wood costing o Railroad networks and intra-modal transfer points o Water availability o Competition o Bayesian logistic regression models for site selection o Policy influence o “Some” sustainability criteria o Population data, climatology data, fragmentation, etc.

41
Acknowledgements o USDA Forest Service Southern Research Station and SRS FIA o USDA Forest Service o Dennis Dykstra and Bob Rummer o US DOT Southeastern Sun Grant Center o University of Tennessee Office of Bioenergy Programs o Sam Jackson, Research Assistant Professor o Bob Longmire, Graphic Design o Sachiko Hurst, Programmer o University of Tennessee Agricultural Experiment Station o Dr. Nicolas Andre, Research Scientist o Kerri Norris, Research Associate o Christy Pritchard, Research Associate o Xu (Nancy) Liu, GRA o Yingjin Wang, former GRA o University of Tennessee College of Business (Frank Guess) o North Carolina State University (Bob Abt) o University of Georgia (Dale Greene)
 Liu, GRA o Yingjin Wang, former GRA o University of Tennessee College of Business (Frank Guess) o North Carolina State University (Bob Abt) o University of Georgia (Dale Greene).")
42
Questions & Discussion “All models are wrong, some are useful” George E.P. Box – Statistician (U of Wisconsin)
.")
Similar presentations


 –Sun Grant Initiative –2010 Drought Center –Industry Partnerships.>")


 – a financial analysis tool for fuel treatment planning Stephanie Rebain USFS Forest Management Service Center FVS Staff.>")


