Download presentation
Presentation is loading. Please wait.

1
Is your Refrigerator Running? Load shapes for (mostly) Appliances and other fun facts as measured in RBSA Metering Data not Dogma, July 2014 Ben Larson, Ecotope
 Appliances and other fun facts as measured in RBSA Metering Data not Dogma, July 2014 Ben Larson, Ecotope.")
2
RBSA Metering Background 104 sites 5-minute intervals 2+ years End-uses – HAC – DHW – Appliances – Lights – Consumer electronics

3
More RBSA Background First comprehensive end use metering studying since ELCAP (which is now nearly 30 years old) RBSA Metering is scheduled to end on September 30, 2014. – We will have collected ~1/4 of the end use load information the region needs by then. http://rtf.nwcouncil.org/subcommittees/enduseload/R TF%20Executive%20Summary%2030%20SEP%202012% 20v04-1.docx http://rtf.nwcouncil.org/subcommittees/enduseload/R TF%20Executive%20Summary%2030%20SEP%202012% 20v04-1.docx

5
Findings: Heat Pumps

6
Resistance starts being used at 45F OAT

8
Heat pumps still have a long way to go Go ductless???

9
We’ve Got One… – Nissan Leaf: 10.25 kWh/day = 3,741 kWh/yr – Wine cooler: 0.38 kWh/day = 139 kWh/yr – Fish tank: 12.8 kWh/day = 4,672 kWh/yr 78 F, 60 gallon, tropical reef: 78 F, 60 gallon, tropical reef: – pumps, skimmer, lights, fans, heater 9

10
Fish Tank 10 Fish Tank

11
Findings: TVs – Nielsen is Right

12
Findings: Appliances Near census achieved in appliance metering (excluded gas dryers and ranges) Appliance Number of appliances On siteMeteredViable data Clothes Washer10310297 Clothes Dryer1039993 Dishwasher936458 Freezer605246 Range (Electric or Gas)1037163 Refrigerator133131120
 Appliance Number of appliances On siteMeteredViable data Clothes Washer Clothes Dryer Dishwasher Freezer Range (Electric or Gas) Refrigerator")
13
Appliance Energy Use Appliance Energy Use per Appliance RBSA Single- Family Survey Energy Use per House Percent of Total Energy kWh/yrSaturationkWh/yr% Clothes Washer550.99542% Clothes Dryer7250.9467930% Dishwasher2390.892139% Freezer6090.5332314% Electric Range3140.8025111% Refrigerator (primary)6041.0060426% Refrigerator (secondary)6000.291748% Overallna 2,298100% Approximately 5% of all houses have gas-fueled dryers. The table reports on electricity only. Seventy-five percent of houses have electric ranges and 85% have electric ovens. The table assumes a combined effective saturation of 80%.

15
Refrigerator Annual kWh through the Years Decline of 13.5 kWh/yr Fit conducted only on primary refrigerators

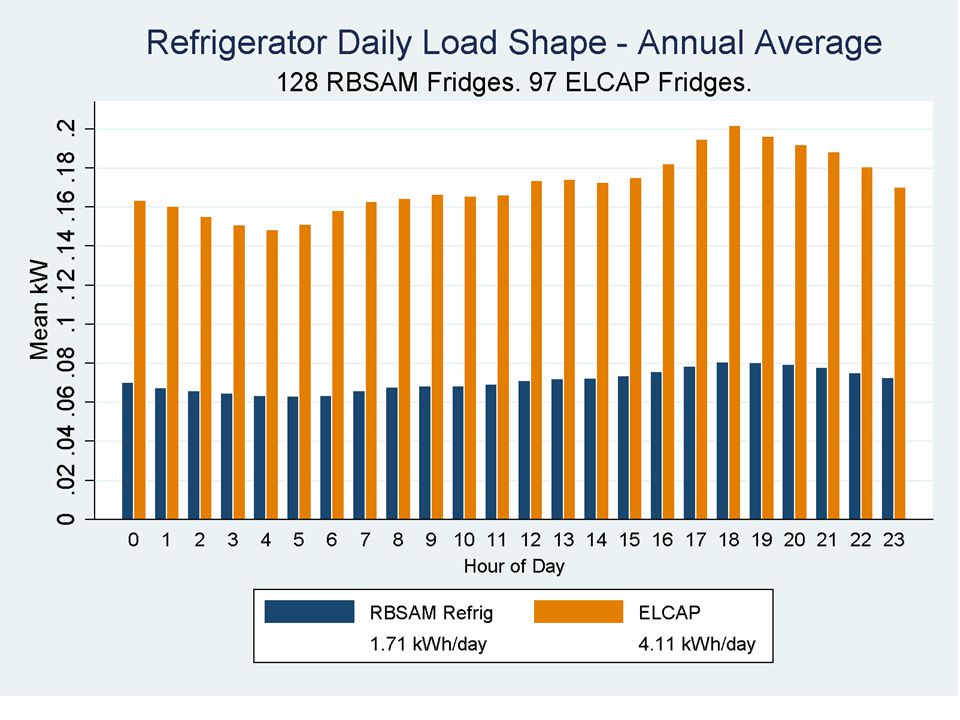
16
Hourly and monthly load shapes for primary refrigerators

17
Refrigerator cycling over 2 days. 5-minute intervals

19
Dishwashers

20
Dishwasher Hourly Load Shape

21
Laundry

22
Dryer energy use vs occupancy

23
More Laundry: Dryer Weekly Loadshape

24
All Done Travel Safely

Similar presentations


 Estimated Yearly Operating Cost (Natural gas water.>")


 3.Coal 4.Natural gas 5.Oil 6.Nuclear power 3, 4, and 5 = 83.5% of U.S. energy.>")


 Electrons.>")


 Electrical Power Electrical Energy.>")

