Download presentation
Presentation is loading. Please wait.

1
Carbon-water interactions with grassland to plantation conversions: effect of vegetation cover on the production of ecosystem services Kathleen Farley, San Diego State University, USA Robert Jackson, Duke University, USA Esteban Jobbagy, Roni Avissar, Somnath Baidkya Roy, Damien Barrett, Charles Cook, David LeMaitre, Bruce McCarl, Brian Murray

2
Conversion of grasslands to plantations: new policy/market incentives Kyoto Protocol Clean Development Mechanism –Issued first CERs (Certified Emission Reductions) in October 2005 EU Emission Trading Scheme –$4.5 billion in emissions credits in 2005 Chicago Climate Exchange
 in October 2005 EU Emission Trading Scheme –$4.5 billion in emissions credits in 2005 Chicago Climate Exchange")
3
South America: plantation area and potential expansion Source: World Forest Institute

4
How does afforestation alter ecosystem processes, in particular water yield

5
Compiled global data set on afforestation effects on water yield

6
Global synthesis Annual runoff data from afforested sites with a previous land cover of grassland or shrubland Included 26 data sets, most from paired catchment studies, with 504 annual observations Analyzed change in runoff as related to original vegetation type, plantation species, plantation age, and mean annual precipitation

7
Results Runoff reductions >75% for at least one year in 1/5 of catchments Runoff reductions, averaged across all plantation ages, were greater in grasslands (44 ± 3%) than shrublands (31 ± 2%) (p<0.001) Eucalypts had greater effect on runoff than pines in sites that were originally grasslands (75 ± 10% vs 40 ± 3%) (p<0.001)
 than shrublands (31 ± 2%) (p<0.001) Eucalypts had greater effect on runoff than pines in sites that were originally grasslands (75 ± 10% vs 40 ± 3%) (p<0.001)")
8
Change in runoff with plantation age Farley et al. 2005

9
Change in runoff with plantation age Farley et al. 2005

10
Change in runoff with plantation age GrasslandShrubland Age (yrs) runoff (%) n n 1-5-16 ± 535-15 ± 336 6-10-50 ± 636-35 ± 440 11-15-67 ± 530-39 ± 430 16-20-58 ± 529-43 ± 423 21-25-42 ± 612-35 ± 420 26-30-54 ± 44-32 ± 420
 runoff (%) n n ± ± ± ± ± ± ± ± ± ± ± ± 420")
11
Change in runoff in wet and dry regions Farley et al. 2005

12
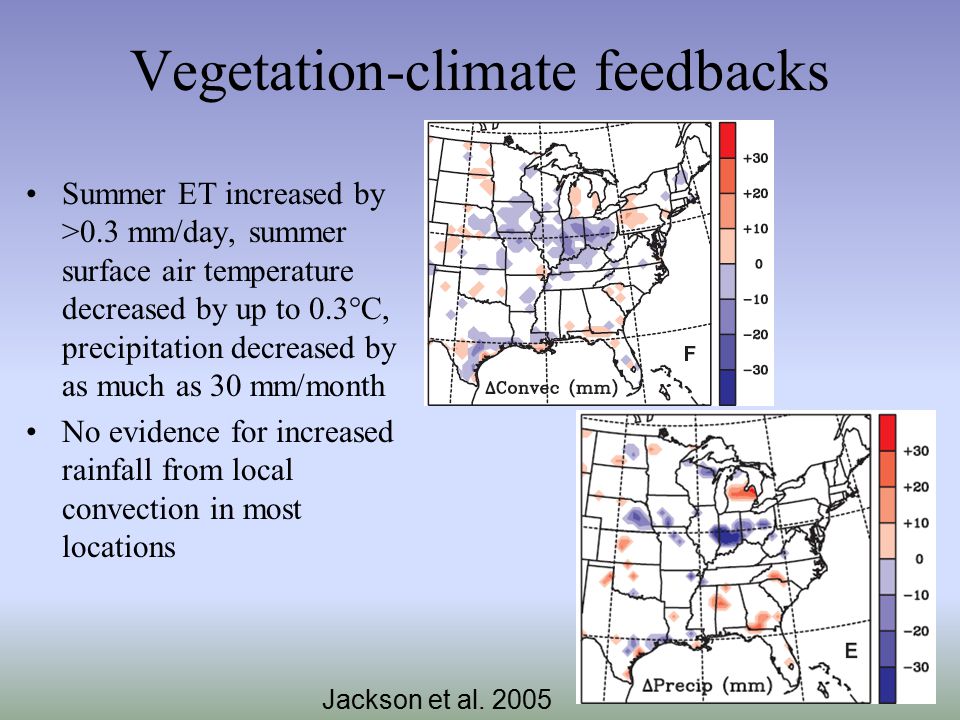
Vegetation-climate feedbacks Simulations for the easterns U.S. (Forest and Agricultural Sector Optimization Model- GHG): crops and pasture replaced by hardwood and softwood plantations Regional Atmospheric Modelling System: in these locations, higher water use of plantations not offset by increased precipitation Jackson et al. 2005
: crops and pasture replaced by hardwood and softwood plantations Regional Atmospheric Modelling System: in these locations, higher water use of plantations not offset by increased precipitation Jackson et al")
13
Vegetation-climate feedbacks Summer ET increased by >0.3 mm/day, summer surface air temperature decreased by up to 0.3°C, precipitation decreased by as much as 30 mm/month No evidence for increased rainfall from local convection in most locations Jackson et al. 2005
14
Soil quality effects Jackson et al. 2005

15
VEGETATION PATTERN ECOSYSTEM PROCESS PRODUCTION OF ECOSYSTEM SERVICES

16
Production of ecosystem services with grassland to plantation conversion There is a carbon for water tradeoff when plantations are established Previous land cover type affects the severity of the tradeoff –Larger, more sustained streamflow reductions when grasslands planted than shrublands Plantation species affects the severity of the tradeoff –More severe streamflow reductions with eucalypts than pines Climatic zone affects the severity of the tradeoff –Lower rainfall zones may be more severely impacted

17
Vulnerability assessment How sensitive is the system to shocks, stresses, or disturbances? What is the current state of the system relative to the threshold of change? What is the system’s ability to adapt to changing conditions? From Luers 2005

18
Vulnerability & water yield How large is the change in runoff relative to available water resources? Change in runoff as a percent of mean annual precipitation consistently ~14-15% Comparison with renewable water can guide policy in areas with limited information

19
0 100 200 300 400 500 Mean annual renewable water (mm) 20040060080010001200 Mean annual rainfall (mm) Namibia Israel Botswana South Africa Europe Zimbabwe Australia Africa Swaziland Canada Lesotho USA Asia World Mozambique Angola Malawi 30% 10% Jackson et al. 2005

20
Vulnerability assessment From Luers 2005

21
Land use change & ecosystem services Vulnerability not just to change in a single service, but to a suite of ecosystem services Scale issues are a challenge to analysis: C vulnerability global, water vulnerability local Uneven markets also a challenge

22
VEGETATION PATTERN ECOSYSTEM PROCESS PRODUCTION OF ECOSYSTEM SERVICES policy

23
Ecuadorian example Páramo grasslands are primary source of drinking water –e.g. Sistema Papallacta provides 50% of Quito’s drinking water, estimated at $2.5 million/year Grassland to plantation conversions likely to reduce water supply

24
Ecuadorian example FONAG: Water fund that collects payments from water users for watershed protection Proposed forestry law: limit plantations above 3500 m

25
VEGETATION PATTERN ECOSYSTEM PROCESS PRODUCTION OF ECOSYSTEM SERVICES policy

26
Acknowledgements Duke University Center on Global Change National Science Foundation US Department of Energy, Southcentral Regional Center of NIGEC

Similar presentations


