Download presentation
Presentation is loading. Please wait.

1
There are three kinds of lies: lies, damned lies, and statistics.
Benjamin Disraeli ( )
")
2
In a student dissertation the writer began by quoting a statistic from a nice, authoritative professional journal. The quote was: "Every year since 1950, the number of American children gunned down has doubled." Joel Best, Damned Lies and Statistics Untangling Numbers from the Media, Politicians, and Activists quoted in

3
Misleading Statistics
Survey problems Choice of sample Question phrasing Misleading graphs Scale Missing numbers Pictographs Correlation vs. Causation Self-Interest Study Partial pictures Deliberate distortions Mistakes

4
Choice of Sample In 1936 Literary Digest magazine sent more than 10 million ballots to readers to get their preferences in the upcoming presidential election between Franklin D. Roosevelt and Alfred M. Landon. The returns indicated that Landon, the Republican nominee, would win handily. Roosevelt won in the first great landslide election of the 20th century. He carried all states except Maine and Vermont.

5
Choice of Sample In an ABC Nightline poll, 186,000 viewers each paid 50 cents to call a “900” telephone number with their opinion about keeping the United Nations in the United States. The results showed that 67% of those who called were in favor of moving the United Nations out of the United States. Taken from Triola, Essentials of Statistics. Addison Wesley.

6
Choice of Sample The Hawaii State Senate held hearings when it was considering a law requiring that motorcyclists wear helmets. Some motorcyclists testified that they had been in crashes in which helmets would not have been helpful. Which important group was unable to testify? Taken from Triola, Essentials of Statistics. Addison Wesley.

7
Choice of Sample [Triola] received a survey from the investment firm Merrill Lynch. It was designed to gauge his satisfaction as a client, and it had specific questions rating the author’s personal Financial Consultant. The cover letter included this statement: “Your responses are extremely valuable to your Financial Consultant…We will share your name and response with your Financial Consultant.” What is wrong with this survey? Taken from Triola, Essentials of Statistics. Addison Wesley.

8
Choice of Sample Possibility of Lying
“Have you ever used illegal drugs?" “Do you favor a constitutional admendment that would outlaw most abortions?" “Have you had more than one sexual partner in the past 6 months?" “Have you ever driven a motor vehicle while intoxicated?"

9
Question Phrasing 97% yes: “Should the President have the line item veto to eliminate waste?” 57% yes: “Should the President have the line item veto, or not?” Taken from Triola, Essentials of Statistics. Addison Wesley.

10
Question Phrasing Would you say that traffic contributes more or less to air pollution than industry? 45% blamed traffic, 27% blamed industry Would you say that industry contributes more or less to air pollution than traffic? 24% blamed traffic, 57% blamed industry Taken from Triola, Essentials of Statistics. Addison Wesley.

11
Question Phrasing “Welfare” vs. “Care for the poor”
“Pro-abortion” vs. “Pro-choice” “Elite” vs. “Expert” “Public servant” vs. “Bureaucrat”

12
Other Survey Issues Are the questions specific enough to draw conclusions from? Is the length of the survey appropriate? If the questions are multiple choice, are the suggested answers appropriate? Do they allow for all possibilities? Do they overlap?

13
Misleading Statistics
Survey problems Choice of sample Question phrasing Misleading graphs Scale Missing numbers Pictographs Correlation vs. Causation Self-Interest Study Partial pictures Deliberate distortions Mistakes

14
Misleading Scale Taken from Triola, Essentials of Statistics. Addison Wesley.

15
Misleading Scale

16
Misleading Scale

17
Missing Numbers

18
Pictographs Double the length, width, and height of a cube, and the volume increases by a factor of eight Taken from Triola, Essentials of Statistics. Addison Wesley.

19
Pictographs

20
Misleading Statistics
Survey problems Choice of sample Question phrasing Misleading graphs Scale Missing numbers Pictographs Correlation vs. Causation Self-Interest Study Partial pictures Deliberate distortions Mistakes

21
Correlation vs. Causation
A study showed that truck drivers weigh more than adults who do not drive trucks. Conclusion: Trucks cause people to gain weight. Taken from Triola, Essentials of Statistics. Addison Wesley.

22
Correlation vs. Causation
Breastfed babies are less likely to be obese. Can we conclude that the breastfeeding is responsible for the decline in obesity?

23
Correlation vs. Causation
There is a strong relationship between a child’s knowledge of nursery rhymes at age 3 and their reading skills over the next few years. Does this mean that nursery rhymes cause children to be able to read better?

24
Misleading Statistics
Survey problems Choice of sample Question phrasing Misleading graphs Scale Missing numbers Pictographs Correlation vs. Causation Self-Interest Study Partial pictures Deliberate distortions Mistakes

25
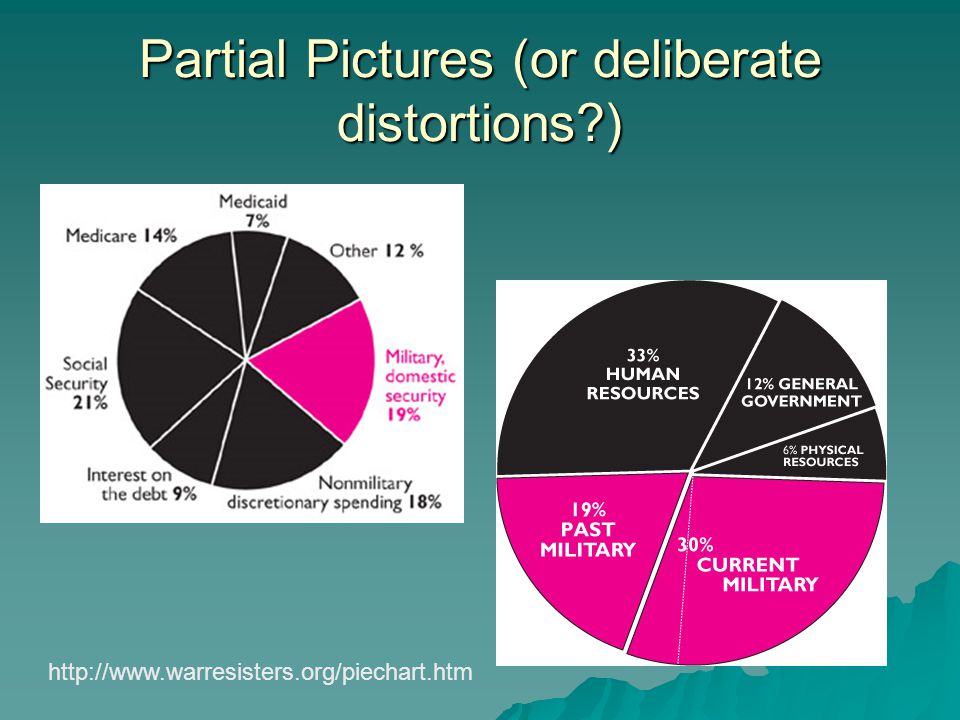
Partial Pictures (or deliberate distortions?)
A car insurance company advertises that their new customers saved an average of $350 by switching to this company’s policy. The Kansas City Star reported on May 25: “In 2005 British publishers released 206,000 new books, compared with the United States’ 172,000 new titles, according to Bowker, a New Jersey company that tracks the industry.

26
Partial Pictures (or deliberate distortions?)
27
Misleading Statistics
Survey problems Choice of sample Question phrasing Misleading graphs Scale Missing numbers Pictographs Correlation vs. Causation Self-Interest Study Partial pictures Deliberate distortions Mistakes

28
Mistakes As reported by CNN and USA Today, the poll found … fewer than one in five – 18 percent – in six of the nine countries believe Arabs carried out the September 11 terrorist attacks. (Three countries wouldn't let Gallup polltakers ask the question.) You won't find those results on Gallup's Web site, however. That's because of one rather big problem: These eye-opening results were "actually the average for the countries surveyed regardless of the size of their populations," the NCPP noted. "Kuwait, with less than 2 million Muslims, was treated the same as Indonesia, which has over 200 million Muslims." By Richard Morin and Claudia Deane Washington Post Staff Writers Friday, March 22, 2002
 You won t find those results on Gallup s Web site, however. That s because of one rather big problem: These eye-opening results were actually the average for the countries surveyed regardless of the size of their populations, the NCPP noted. Kuwait, with less than 2 million Muslims, was treated the same as Indonesia, which has over 200 million Muslims. By Richard Morin and Claudia Deane Washington Post Staff Writers Friday, March 22,")
29
Mistakes Using inappropriate averages
Using the wrong statistical analysis Generalizing to the wrong population Misinterpreting results Simple numerical errors …

Similar presentations

>")


