Download presentation
Presentation is loading. Please wait.

1
How To Optimize Your Observing Sessions Using Selected Weather Web Tools Reg Dunkley

2
The Problem What We Have Here Is a Failure to Communicate Traditional Text Forecasts Limited to 7 Items Press and TV Compress Message to a Confusing Icon Weather Channels Generalize to a Broad Audience General Public Are Not Concerned With Presence of Thin High Cloud Particularly If It Appears Overnight Mainstream Weather Information Not Meeting Needs of Astronomers

3
The Solution A Picture Is Worth A Thousand Words A Movie Is Worth A Hundred Pictures Advances In – Data Acquisition and Quality Control – Remote Sensing – Computational Power – Sophisticated Numerical Atmospheric Models Has Resulted in Spectacular Improvements In Weather Prediction And Graphics The Web Is Ideal Venue For Tailored Graphical Products

4
The Challenge The Web Is a Vast Information Smorgasbord Teeming With Weather Sites of Varying Quality This Leads To – Information Overload – Data Indigestion – and Confusion To Prevent Overwhelm: – Focus on a Few Trusted Sites – Understand How to Use Their Tools

5
The Plan … if there is interest Conduct a few short sessions demonstrating selected weather web pages that support operational decision making for astronomy. To interpret these pages it is helpful to begin with some background information. And that is tonight’s topic.

6
Basic Concepts Pressure Water Vapour Why Clouds Don’t Fall Down Coriolis Force Circulation Around High and Low Pressure Why Skies Are Clear Near High Pressure Areas

7
Atmospheric Pressure Has Nothing To Do With: Pressure Washers Pressure from Wind Gusts Or Stress and Anxiety

8
Atmospheric Pressure The pressure measured by a barometer is simply the weight of the column of air above it. (Hydrostatic Balance) The barometer is sort of the bathroom scale for the atmosphere As we climb – Pressure Drops – An Air Parcel Expands – And Cools Mean Sea Level Pressure – 1013.25 millibars or 101.325 kilo pascals Surface Pressure Varies from 920 millibars to 1070 millibars The areas of high and low pressure simply reflect that the air is not uniformly distributed about the earth.
 The barometer is sort of the bathroom scale for the atmosphere As we climb – Pressure Drops – An Air Parcel Expands – And Cools Mean Sea Level Pressure – millibars or kilo pascals Surface Pressure Varies from 920 millibars to 1070 millibars The areas of high and low pressure simply reflect that the air is not uniformly distributed about the earth..")
9
Water Vapour It is an invisible gas and not to be confused with steam or Vicks VapoRub! It comprises ~ 2% atmosphere When water vapour condenses into water droplets it releases Latent Heat of Vapourization This energy heats and expands local air parcel making it less dense and more buoyant with respect to surroundings. This is the main energy source of Thunderstorms and Hurricanes.

10
Why Don’t Clouds Fall Down? Clouds are comprised of water droplets or ice crystals For very small water droplets friction force of rising air dominates gravitation force (weight) of droplet. Tiny water droplets are easily suspended by slowly rising air currents. The speed of a second hand on a wall clock is enough So to create a cloud all you need is some moisture and rising air Suspended ice crystals can grow into snowflakes with a much greater air resistance Rain drops are just recently melted snowflakes
 of droplet. Tiny water droplets are easily suspended by slowly rising air currents. The speed of a second hand on a wall clock is enough So to create a cloud all you need is some moisture and rising air Suspended ice crystals can grow into snowflakes with a much greater air resistance Rain drops are just recently melted snowflakes.")
11
What Causes Air to Rise? Mixing From Wind Flow Over Ground Hot Air Rises (parking lots versus grass) Latent Heat Release Enhances Convection Currents (Popcorn Shaped Cumulus Clouds) Upslope Flow Convergence (air flowing together) Large Scale Dynamics … Fronts & Things
 Latent Heat Release Enhances Convection Currents (Popcorn Shaped Cumulus Clouds) Upslope Flow Convergence (air flowing together) Large Scale Dynamics … Fronts & Things.")
13
LAX Victoria 4221 km 5224 km N 553 km/h 683 km/h Coriolis Force Imagine that you are flying due north from Los Angeles to Victoria. The eastward tangential velocity due to the Earth ’ s rotation is 130 km/h faster in LA than in Victoria. As you travel north you will notice that you are moving eastward more rapidly than the earth beneath you. From the perspective of earth an apparent force seems to be pushing you to the right. This Coriolis force is stronger at higher latitudes because the radius from the axis of rotation changes more rapidly as you approach the pole. The Faster you move the more pronounced the Coriolis Force

14
Surface Analysis … Geostrophic Flow L H

15
L H Since more air is heaped up near the High The difference in weight (pressure) will cause air to flow towards the Low Centre
 will cause air to flow towards the Low Centre")
16
Surface Analysis … Geostrophic Flow L H But as the air moves the Coriolis Force (Red Arrow) deflects the moving air to the right
 deflects the moving air to the right")
17
Surface Analysis … Geostrophic Flow L H Eventually the wind is travelling at a sufficient speed so that the Coriolis Force (red) Balances the force due to the pressure difference (green) And equilibrium is achieved.
 Balances the force due to the pressure difference (green) And equilibrium is achieved.")
18
Surface Analysis … Geostrophic Flow L H This “ Geostrophic Balance ” causes air in the Northern Hemisphere to flow Counter clockwise about the low and clockwise about the high || to isobars. The greater the pressure difference (closer the isobars) the stronger the flow.
 the stronger the flow..")
19
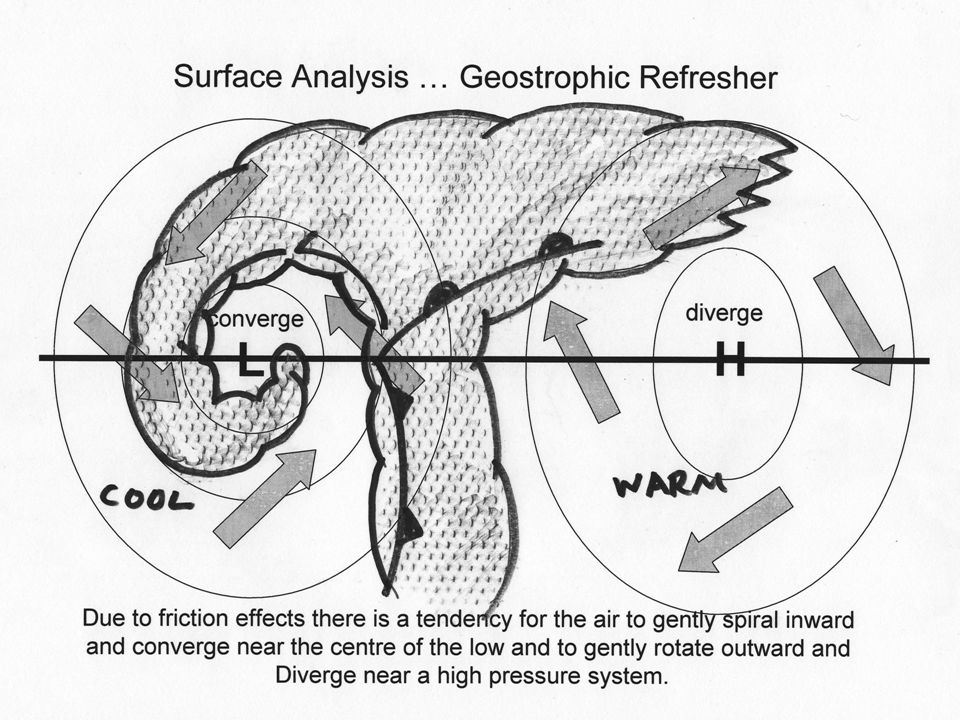
Surface Analysis … Geostrophic Flow L H Due to friction effects there is a tendency for the air to gently spiral inward and converge near the centre of the low and to gently rotate outward and Diverge near a high pressure system. converge diverge

20
Surface Analysis … Geostrophic Flow Sea Level L H Vertical Cross section showing Converging and Diverging Circulation Between a High and Low Pressure System 600 mb Level of Non Divergence Upper Level Divergence Low Level Divergence Low Level Convergence Upper Level Convergence

21
Surface Analysis … Geostrophic Flow Sea Level L H Rising Air near Low Fosters Cloud and Precipitation Sinking Air Near High Causes Sunny Conditions 600 mb Level of Non Divergence Upper Level Divergence Low Level Divergence Low Level Convergence Upper Level Convergence Rising Moist Air Sinking Dry Air

Similar presentations


 Weather.>")
