Download presentation
Presentation is loading. Please wait.

1
Impaired Uses and Poor Water Quality in West Bay: Causes and Consequences R. Lawrence Swanson School of Marine and Atmospheric Sciences Stony Brook University May 12, 2014

2
Support provided by Battelle New York State Department of Environmental Conservation New York State Department of State New York State Resiliency Institute for Storms & Emergencies (NYS RISE) Town of Hempstead US Geological Survey
 Town of Hempstead US Geological Survey")
3
Contributors to this Report Investigators Henry Bokuniewicz Bruce Brownawell Kirk Cochran Charles Flagg Roger Flood Mike Frisk Chris Gobler Anne McElroy Larry Swanson Robert Wilson Students Cassie Bauer Anne Cooper Doherty Ryan Wallace Kaitlin Willig Dongming Yang Collaborators Jim Browne, ToH Tom Doheny, ToH (ret.) Scotty’s Marina and Fishing
 Scotty’s Marina and Fishing")
4
Impaired waters – those where designated uses are not fully supported West Bay and Middle Bay closed to shellfishing eutrophic

5
Cause of Eutrophication Excess nitrogen Limited flushing

6
Consequences of Eutrophication Excessive growth of Ulva habitat impingement, transient hypoxia, toxic to fish larvae, recreation limitation, odors, disposal costs 10-year TN concentrations exceed 0.45 mg/L at 11 of 15 stations Sediments enriched in organic carbon Harmful algal blooms of Heterosigma akashiwo and Peridinium spp.

7
Discharge and Nitrogen Loading to West Bay Flow gal x 10 6 /y TN ton/y Lawrence WPCP 1 44230 Greater Atlantic Beach WPCP 2 18211 Long Beach WPCP 3 1788157 Bay Park WPCP 4 18,1772247 Pines Brook 5 (mean of 1992-1996)8145.8 East Meadow Brook 5 (mean of 1992-1996)29965.5 Groundwater, Sewer District II 5 Shallow Deep 5670 2600 91 2 Total 32,669 2549.3 1 Quarterly data (November, February, May, August) 2008-2011. 2 Spot data, Summer 2012. 3 Monthly flow data and quarterly nitrogen data, December 2010-August 2012. 4 Monthly data, 2010-2011 5 Monti, J. and M.P. Scorca. 2003. Trends in Nitrogen Concentration and Nitrogen Loads Entering the South Shore Estuary Reserve from Streams and Ground-Water Discharge in Nassau and Suffolk Counties, Long Island, New York 1952-97. U.S. Geological Survey, Water Resources Investigations Report 02-4255. Corum, NY. 36 pp.

8
Hazen and Sawyer, 2014

9
Annual daily averaged discharge at Bay Park and Cedar Creek WPCP 1952-2010.

10
Total Nitrogen- Effluent Bay Park STP 2007-2011

11
Nitrate concentration vs. elevation in winter months (October-March) at Hog Island Channel Data Station. (Data from US Geological Survey.) Mean = 0.37 mg/L
 at Hog Island Channel Data Station. (Data from US Geological Survey.) Mean = 0.37 mg/L.")
12
Comparison between Ulva growth and surface nitrate concentrations.

13
= Jones Beach Inlet = Hewlett Bay = Middle Bay = Eastern Bay Phytoplankton Biomass Hewlett Bay, and to a lesser extent, Middle Bay experience massive phytoplankton blooms during summer.

14
Dissolved oxygen concentrations (mg O 2 /L) as a function of time in Hewlett Bay.
 as a function of time in Hewlett Bay.")
15
Dye Distribution Released from Bay Park Outfall Town of Hempstead, 1987 USGS Water Quality Station, Island Park

16
Residence times of particles in West and Middle Bays. Color bar is time in hours.

17
Data from US Geological Survey

18
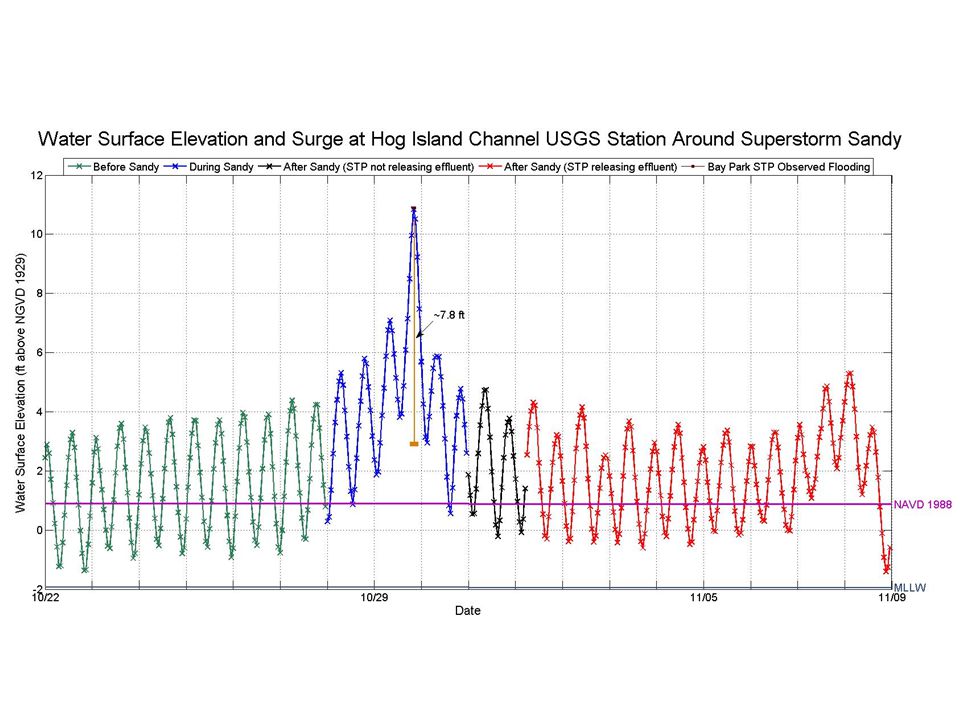
Bay Park Sewage Treatment Plant Flooding from Superstorm Sandy

20
Bay Park Sewage Treatment Plant Sandy Timeline Date Bay Park STP goes offline. From this point, no raw sewage entered the plant and no raw or partially treated sewage left the plant. Oct 29, 2012 2200 Raw sewage was pumped to 3 waterways (Grand Canal, Parsonage Creek, and Mill River) to help relieve collection system. Oct 30, 2012 – Nov 1, 2012 Wastewater “stacked-up” in the collection system and eventually overflowed at lower elevations (e.g., manholes). Oct 29, 2012 2200 – Nov 1, 2012 0600 STP comes back online.Nov 1, 2012 0600 Effluent is pumped alternately via the main outfall in Reynolds Channel and the auxiliary outfall in Mill River at low tide and large head plus high volume flow, respectively. Nov 1, 2012 Influent pumping/Raw sewage pumps. Effluent is treated at reduced levels of secondary treatment. Effluent is no longer released via the auxiliary outfall at high tide.Nov 24, 2012 SPDES permit compliance achieved.Dec 13, 2012
 to help relieve collection system. Oct 30, 2012 – Nov 1, 2012 Wastewater stacked-up in the collection system and eventually overflowed at lower elevations (e.g., manholes). Oct 29, – Nov 1, STP comes back online.Nov 1, Effluent is pumped alternately via the main outfall in Reynolds Channel and the auxiliary outfall in Mill River at low tide and large head plus high volume flow, respectively. Nov 1, 2012 Influent pumping/Raw sewage pumps. Effluent is treated at reduced levels of secondary treatment. Effluent is no longer released via the auxiliary outfall at high tide.Nov 24, 2012 SPDES permit compliance achieved.Dec 13,")
22
Range of Nitrate Concentrations Before and After Superstorm Sandy (1 standard deviation) Mean 1 standard deviation
 Mean 1 standard deviation")
23
Bay Park STP Effluent Water Quality (2012) Nassau County Department of Public Works
 Nassau County Department of Public Works")
25
Flushing Analysis Using Particle Tracking in East Rockaway Channel: SUNY Modeling Analysis Nassau County Department of Public Works

26
To enhance resiliency and reduce impaired uses within West Bay construct an ocean outfall implement tertiary treatment at the Bay Park STP recycle a portion of the tertiary treated sewage to groundwater

27
Next Steps – Phase II of NYS RISE? Risk Assessment Undertake a thorough evaluation of the environmental conditions in and around the Cedar Creek and Bergen Point ocean outfalls.

Similar presentations


 brings nitrogen.>")


 444-0465.>")

