Download presentation
Presentation is loading. Please wait.

1
Fiber Optic Temperature Sensing in the Walker Basin: From Seedbeds to Seepage Scott W. Tyler University of Nevada, Reno Dept. of Geologic Sciences and Engineering tylers@unr.edu http://wolfweb.unr.edu/homepage/tylers/index.html/

2
What is Fiber Optic Temperature Sensing The measurement of temperature (and) using only the properties of a fiber optic cable. The measurement of temperature (and) using only the properties of a fiber optic cable. The fiber optic cable serves as the thermometer, with a laser serving as the illumination source. The fiber optic cable serves as the thermometer, with a laser serving as the illumination source. Measurements of temperature every 1-2 yards for as long as 20 miles can be resolved, every 10 seconds to 60 minutes, with temperature resolution of 0.02-1.0 o F. Measurements of temperature every 1-2 yards for as long as 20 miles can be resolved, every 10 seconds to 60 minutes, with temperature resolution of 0.02-1.0 o F.
 using only the properties of a fiber optic cable. The fiber optic cable serves as the thermometer, with a laser serving as the illumination source. The fiber optic cable serves as the thermometer, with a laser serving as the illumination source. Measurements of temperature every 1-2 yards for as long as 20 miles can be resolved, every 10 seconds to 60 minutes, with temperature resolution of o F. Measurements of temperature every 1-2 yards for as long as 20 miles can be resolved, every 10 seconds to 60 minutes, with temperature resolution of o F..")
3
How Does it Work? 99.999% of the light energy goes down the fiber optic cable without loss 99.999% of the light energy goes down the fiber optic cable without loss However, Rayleigh, Raman and Brillouin scattering all occur as light is passed through a fiber optic cable. However, Rayleigh, Raman and Brillouin scattering all occur as light is passed through a fiber optic cable. The scattered returned light’s energy (returned at different frequencies) is related to the temperature of the glass fiber optic. The scattered returned light’s energy (returned at different frequencies) is related to the temperature of the glass fiber optic.
 is related to the temperature of the glass fiber optic. The scattered returned light’s energy (returned at different frequencies) is related to the temperature of the glass fiber optic..")
4
How do we know from where it came? The scattered light returns to the detector at the speed of light. So by counting the number of nanoseconds between our laser pulse and the returned signal, the distance is simply: The scattered light returns to the detector at the speed of light. So by counting the number of nanoseconds between our laser pulse and the returned signal, the distance is simply: X = ½ c * time since the laser was fired X = ½ c * time since the laser was fired For every 10 nanoseconds, the light pulse “flies” about 1 meter. For every 10 nanoseconds, the light pulse “flies” about 1 meter.

5
Cable lengths up to 30 km Resolution of Temperature every 1-2 meters! Temperature accuracy up to 0.01 o C Inexpensive fiber costs ($0.20-$1/yard) Fiber is completely reusable and repairable in the field.
 Fiber is completely reusable and repairable in the field..")
6
Advantages Fiber optic methods offer unparallel ability to continuously monitor temperatures Fiber optic methods offer unparallel ability to continuously monitor temperatures Cost of fiber optic cable is very low ($0.20-$1/yard) Cost of fiber optic cable is very low ($0.20-$1/yard) Cable is easily deployed, removable and completely repairable. Cable is easily deployed, removable and completely repairable.

7
Why Study Temperature on the Walker System? Many hydrologic, geologic and environmental processes are governed by temperature. Many hydrologic, geologic and environmental processes are governed by temperature. In the Walker Basin, we can use temperature to indicated areas where subsurface irrigation return flows are entering the river. In the Walker Basin, we can use temperature to indicated areas where subsurface irrigation return flows are entering the river. We can also use it to measure seedbed temperatures during transition to different irrigation strategies. We can also use it to measure seedbed temperatures during transition to different irrigation strategies.

8
Additional Project Support Project A: Measuring stratification and mixing in Walker Lake to understand fish habitat development. Project A: Measuring stratification and mixing in Walker Lake to understand fish habitat development. Project A: Monitoring Walker River temperatures to assess habitat and restoration. Project A: Monitoring Walker River temperatures to assess habitat and restoration. Project B/C: Development of improved irrigation scheduling by monitoring soil moisture status. Project B/C: Development of improved irrigation scheduling by monitoring soil moisture status. Project E: Assessing impacts of increased flows on downstream temperatures and salinity. Project E: Assessing impacts of increased flows on downstream temperatures and salinity.

9
Two Example Applications Measuring mixing in the thermocline of Lake Tahoe (Selker, Schladow Torgersen and Hausner) Measuring mixing in the thermocline of Lake Tahoe (Selker, Schladow Torgersen and Hausner) Distributed soil temperature monitoring at UNR’s Alternative Agriculture Sites (Project F). Distributed soil temperature monitoring at UNR’s Alternative Agriculture Sites (Project F).
..")
10
Deep Lake Tahoe Measurements June 7, 2007

11
Lake Tahoe, CA Test Site

12
Cable Deployment Cables were deployed from the UC Davis research vessel John LeConte Cables were deployed from the UC Davis research vessel John LeConte Cable was lowered to the bottom of the lake, then pulled up 20 m Cable was lowered to the bottom of the lake, then pulled up 20 m Total depth was approximately 411 m. Total depth was approximately 411 m.

13
Weather Conditions: June 6 The previous day was very cold and windy The previous day was very cold and windy Strong westerly's Strong westerly's

14
Weather Conditions: June 7 Warm, calm day Warm, calm day Smooth water Smooth water

15
Complete Vertical Profile: Single Ended

16
Note the wavy pattern of the warm water interface! Causing mixing of nutrients to the bottom waters

17
Walker River Water Applications Understanding groundwater/river exchanges are crucial to developing hydrologic models of the basin Understanding groundwater/river exchanges are crucial to developing hydrologic models of the basin Areas of localized saline groundwater inflows into the Walker River will have cool waters during the summer months. Areas of localized saline groundwater inflows into the Walker River will have cool waters during the summer months. Fiber optic cables will be deployed for 2-4 days along selected reaches to map inflows. Fiber optic cables will be deployed for 2-4 days along selected reaches to map inflows. Chemical sampling of inflows will be done using hand drilled wells Chemical sampling of inflows will be done using hand drilled wells Strategies for reducing saline inflows can then be developed at the local scale. Strategies for reducing saline inflows can then be developed at the local scale.

18
Linear Parallel Seepage Monitoring

19
Walker Lake Studies The dynamics of the mixing of Walker Lake are important for understanding habitat and refuges. The dynamics of the mixing of Walker Lake are important for understanding habitat and refuges. In coordination with project team members and the USGS, periodic measurements of the vertical temperature profile in the lake will be performed. In coordination with project team members and the USGS, periodic measurements of the vertical temperature profile in the lake will be performed. Additional fibers will be installed in areas of anticipated submarine groundwater inflows into the lake for input into groundwater models being developed. Additional fibers will be installed in areas of anticipated submarine groundwater inflows into the lake for input into groundwater models being developed.

20
Seedbed Temperatures Fiber optic cables can be used to measure, at large scales, the shallow soil temperatures. Fiber optic cables can be used to measure, at large scales, the shallow soil temperatures. Alternative agriculture studies and reduced water application can allow much higher soil temperatures to develop, which may limit germination and plant growth. Alternative agriculture studies and reduced water application can allow much higher soil temperatures to develop, which may limit germination and plant growth. Almost 2 miles of fiber have been installed 15 cm beneath the soil at the 5C and Wildlife Refuge Test Sites Almost 2 miles of fiber have been installed 15 cm beneath the soil at the 5C and Wildlife Refuge Test Sites Temperature will be monitored to determine: Temperature will be monitored to determine: Maximum daily soil temperatures during summer Maximum daily soil temperatures during summer Infiltration rates (measured by cooling of the soil) Infiltration rates (measured by cooling of the soil) Soil Moisture by time to maximum temperature Soil Moisture by time to maximum temperature
 Infiltration rates (measured by cooling of the soil) Soil Moisture by time to maximum temperature Soil Moisture by time to maximum temperature.")
22
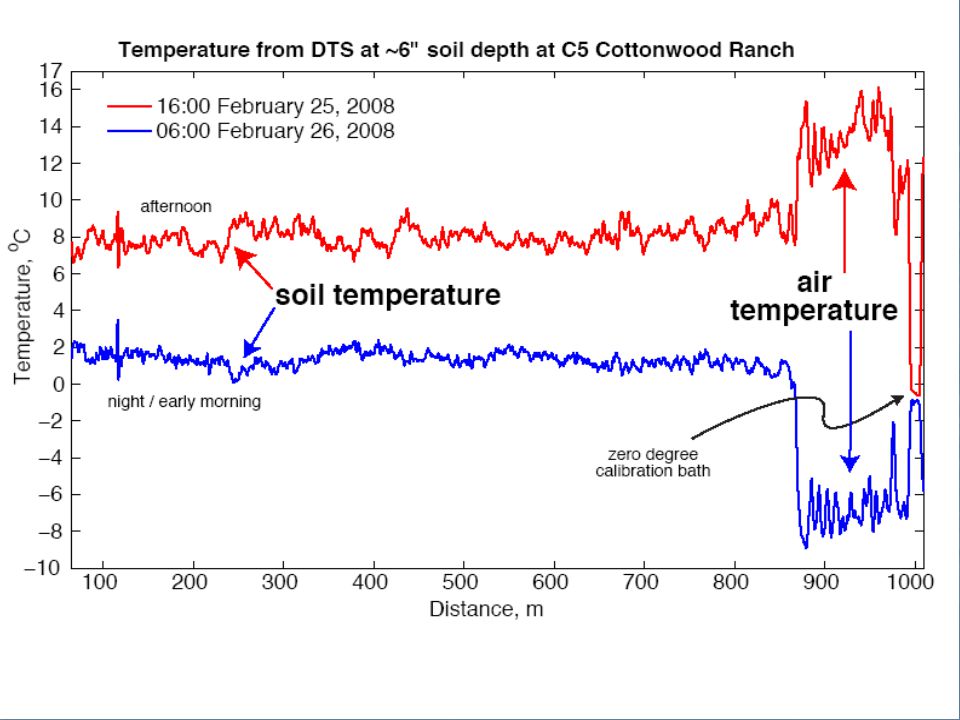
5C Ranch Data Base case temperatures measured in mid February, prior to germination. Base case temperatures measured in mid February, prior to germination. Soils are moderately coarse and background soil moisture is uniform Soils are moderately coarse and background soil moisture is uniform Watch for part of the cable that is in the air (cold at night, warm in the day) Watch for part of the cable that is in the air (cold at night, warm in the day)
 Watch for part of the cable that is in the air (cold at night, warm in the day).")
24
Summary Fiber optic temperatures are supporting many of UNR’s Walker Basin Project. Fiber optic temperatures are supporting many of UNR’s Walker Basin Project. Low cost and detail of information in both the lake, river and soil offer unique opportunities to monitor both current conditions and the impacts of future decisions on the Walker basin. Low cost and detail of information in both the lake, river and soil offer unique opportunities to monitor both current conditions and the impacts of future decisions on the Walker basin. The system has benefits beyond the current applications, specifically to improving water use efficiency of irrigation. The system has benefits beyond the current applications, specifically to improving water use efficiency of irrigation. Nevada is one of the leaders in this technology. Nevada is one of the leaders in this technology.

Similar presentations


>")
 Model Input>")


