Download presentation
Presentation is loading. Please wait.

1
Lecture 4

2
Bullish StrategiesRiskReward Call purchaselimitedunlimited Synthetic long stockunlimitedunlimited Bull spreadlimitedlimited Protective Putlimitedunlimited Bullish calendar spreadlimitedunlimited Covered callunlimitedlimited Naked put writeunlimitedlimited

3
Bearish StrategiesRiskReward Put purchaselimitedunlimited Synthetic Putlimitedunlimited Synthetic short saleunlimitedunlimited Bear spreadlimitedlimited Covered put writeunlimitedlimited Bearish calendar spreadlimitedunlimited Naked call writeunlimitedlimited

4
Long Stock, Short Call

5
Profit = S + call - P BE = P - call

6
Long Stock, Long Put

7
Profit = P - put - S

8
Short Stock, Long Call

10
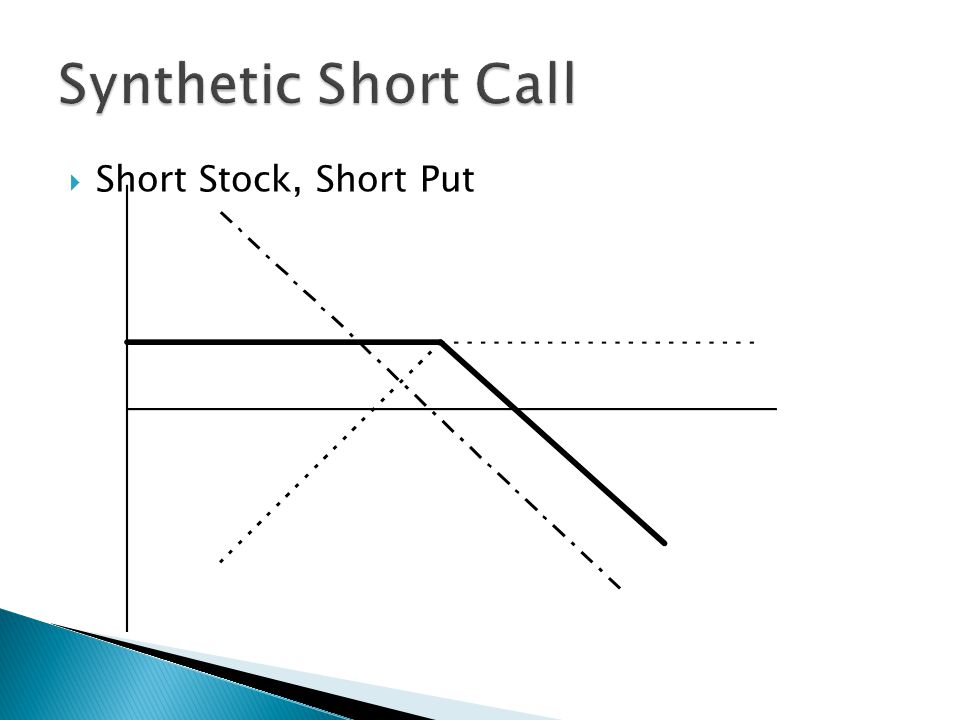
Short Stock, Short Put

12
Short Put, Long Call

15
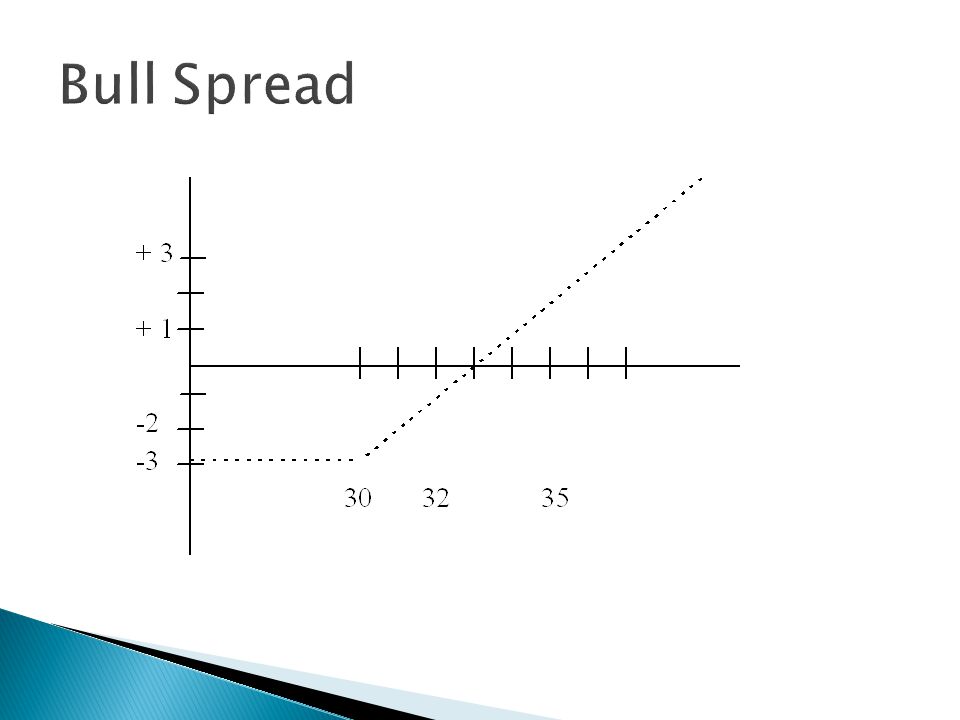
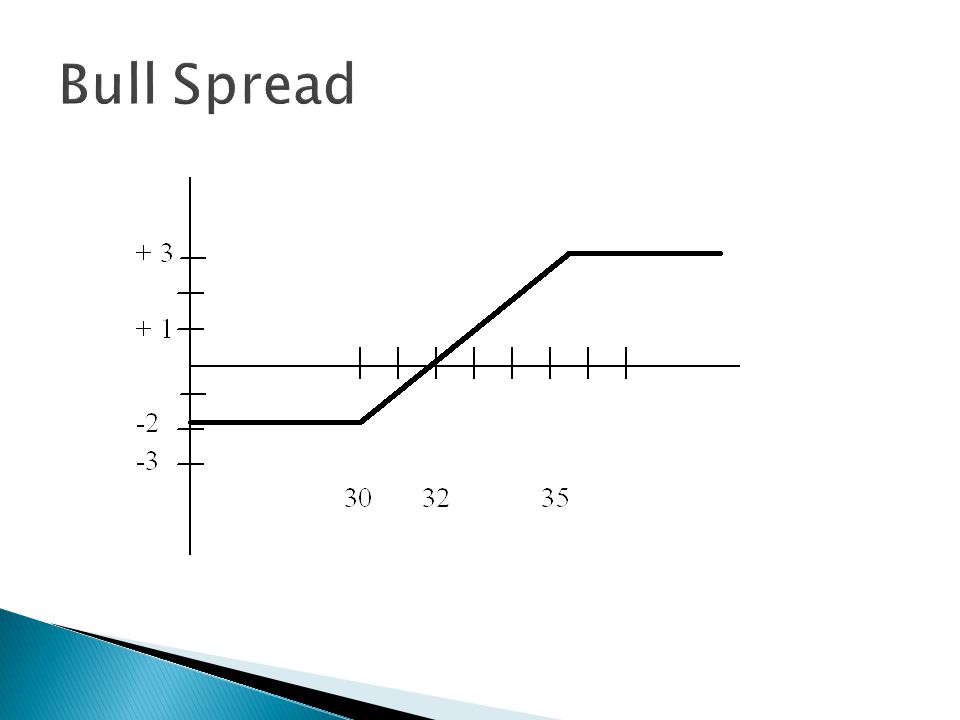
Long Call @ s1 s1 < s2 Short Call @ s2 Max Profit = s2 - s1 - c1 + c2 Break Even = s2 - MP = s1 - c2 + c1

16
Example Price = 32Oct35C = 1t=60days/365 Oct30C = 3v =.24 Buy Oct30C = -3 Sell Oct35C = +1 Max Profit = 35-30-3+1 = 3 BE = 30-1+3 = 32 Net Debit = -3 + 1 = -2

21
Profit / Loss Diagram Table

22
Compute probability of bull spread Example V t =.24 (60/365).5 =.097 Prob (<32) = N[ln(32/32) /.097] =.5000 Prob (>32) = 1 -.500 =.5000 Max Profit = $300 Max Loss = -$200 at 50% odds, makes good sense
![ Compute probability of bull spread Example V t =.24 (60/365).5 =.097 Prob (<32) = N[ln(32/32) /.097] =.5000 Prob (>32) = =.5000 Max Profit = $300 Max Loss = -$200 at 50% odds, makes good sense](http://images.slideplayer.com/12/3408331/slides/slide_22.jpg " Compute probability of bull spread Example V t =.24 (60/365).5 =.097 Prob (<32) = N[ln(32/32) /.097] =.5000 Prob (>32) = =.5000 Max Profit = $300 Max Loss = -$200 at 50% odds, makes good sense")
24
s1 < P << s2 Good probability, good profit potential

25
P < s1 < s2 Small Cost, high profit, low prob

26
S1 < s2 < P Low profit, high prob

27
Long Put @ s1 s1 < s2 Short put @ s2 example (Credit Spread) Price = 55 Jan50P = 2 Jan60P = 7 Net Credit = p2 - p1 = + 7 - 2 = + 5 Break Even = S2 - credit = 60 - 5 = 55
 Price = 55 Jan50P = 2 Jan60P = 7 Net Credit = p2 - p1 = = + 5 Break Even = S2 - credit = = 55")
31
Short Call @ s1 s1 < s2 Long Call @ s2credit spread

32
Short Call @ s1 s1 < s2 Long Call @ s2credit spread Example P = 55Jan60C = 2Jan50C = 7 Net Credit = 7 - 2 = 5BE = 50 + 5 = 55

33
Short Call @ s1 s1 < s2 Long Call @ s2credit spread Example P = 55Jan60C = 2Jan50C = 7 Net Credit = 7 - 2 = 5BE = 50 + 5 = 55

34
Long Put @ s1 s1 > s2 Short Put @ s2debit spread

35
Long Put @ s1 s1 > s2 Short Put @ s2debit spread Example P = 55Jan50P = 2Jan60P = 7 Net Debit = 7 - 2 = 5BE = 60 - 5 = 55

36
Long Put @ s1 s1 > s2 Short Put @ s2debit spread Example P = 55Jan50P = 2Jan60P = 7 Net Debit = 7 - 2 = 5BE = 60 - 5 = 55

37
+Credit spread - assignment risk ? What causes assignment -Large Credit = P well above lower strike Example: p = 59, Jan60C=1, Jan50C=9

38
Long Stock, Long Call, Short 2 Calls Example Own stock @ $48 Price = 42 Oct40Call = 4 (buy) Oct45Call = 2 (sell 2) Net Credit = 0 BE = 44
 Oct45Call = 2 (sell 2) Net Credit = 0 BE = 44")
44
PriceP/LStP/L Sh CP/L Lg CNet P/L 35-1300+400-400-1300 38-1000+400-400-1000 40-800+400-400-800 42-600+400-200-400 44-400+40000 45-300+400+100+200 480-200+400+200 50+200-600+600+200

45
If call is deep in the money and has no time to exp, a bull spread can be used to simulate a covered call. Example Price = 49 Sell Apr50C = 3 Buy Apr35C = 14

47
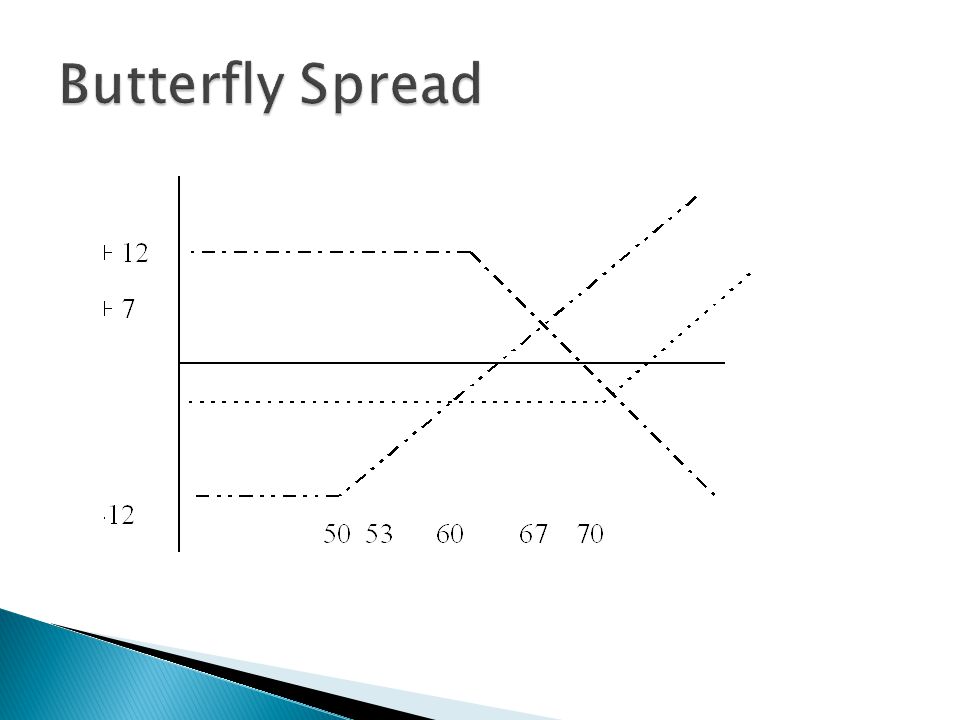
A neutral position that combines both a bear spread and a bull spread Long call @ s1s1 < s2 < s3 Short 2 calls @ s2 Long call @ s3 Example Price = 60 buy July50C = 121200 debit short2 July60C = 61200 credit buy July70C = 3 300 debit 300 Net Debit

52
Multiple ways to create the butterfly spread example Strike506070 Call1262 Put1511 Butterfly PositionsNet Position Buy 50C / sell 2 60C / buy 70C2 debit Buy50C/sell 60C/buy70P/sell60P12 debit Buy50P/sell60P/Buy70C/sell60C8 credit Buy50P / sell 2 60P / buy 70P2 debit

53
Long stock, short multiple calls example 2:1 ratio call write Price = 49 Oct50C = 6 sell 2 calls and long 100 stock

55
example 2:1 ratio call write Price = 49 Oct50C = 6 sell 2 calls and long 100 stock Price drops to 40 Oct50C = 1 Oct40C = 4 Buy 2 Oct50C = profit = 12 - 2 = 10 Sell 2 Oct40C apply to stock price & pretend we own stock at $39

57
Max Profit = m(S-P) + nCm = # stock lots Upside BE = S + MP/(n-m)n = # of Call ks Downside BE = S - MP / m Example Max Profit = 1 (50-49) + 2 (6) = 13 Upside BE = 50 + 13/ (2-1) = 63 Downside BE = 50 - 13/1 = 37
 + nCm = # stock lots Upside BE = S + MP/(n-m)n = # of Call ks Downside BE = S - MP / m Example Max Profit = 1 (50-49) + 2 (6) = 13 Upside BE = / (2-1) = 63 Downside BE = /1 = 37")
58
Example 3:1 Buy 1 lot stock @ 49 sell 3 oct50c@18 Max Profit = 1 (50-49) + 3 (6) = 19 Upside BE = 50 + 19/ (3-1) = 59.5 Downside BE = 50 - 19/1 = 31
 + 3 (6) = 19 Upside BE = / (3-1) = 59.5 Downside BE = /1 = 31")
59
Example 3:1 Buy 1 lot stock @ 49 sell 3 oct50c@18 Max Profit = 1 (50-49) + 3 (6) = 19 Upside BE = 50 + 19/ (3-1) = 59.5 Downside BE = 50 - 19/1 = 31
 + 3 (6) = 19 Upside BE = / (3-1) = 59.5 Downside BE = /1 = 31")
60
Long stock, s1 < P < s2 short in money call (s1), short out of money call (s2) Max Profit = c1 + c2 + s1 - P Downside BE = s1 - MP Upside BE = s2 + MP Example Price = 65 Oct60C = 8 Oct70C = 3
, short out of money call (s2) Max Profit = c1 + c2 + s1 - P Downside BE = s1 - MP Upside BE = s2 + MP Example Price = 65 Oct60C = 8 Oct70C = 3")
64
Don’t do - because

65
Long call @ s1s1 < s2 Short X calls @ s2 Example 2:1 Price = 44 Apr40C = 5buy 1 Apr45C = 3sell 2 BE = 51 MP = 6

66
Step 1

67
Step 2

70
3:1 example increase profit lower BE 2:1

71
3:1 example increase profit lower BE 3:1

72
Short Put Short Call Example Price = 45 Jan45C = 4 Jan45P =3

73
Same Example - But, sell 4 of each Price = 45 Jan45C = 4 Jan45P =3

74
Long Stock Short Call Short Put example Price = 51buy 100 shares Jan50C = 5sell 1 call Jan50P = 4sell 1 put Max Profit = Premium + S - P = 9 + 50 - 51 = 8 BE = (P+S-Prem)/2 = 46
/2 = 46")
77
Short put (out of money) Short call (out of money) example price = 65 Jan70C = 4 Jan60P = 3 Downside BE = Sp - put - call = 60-3-4 = 53 Upside BE = Sc + put + call = 70+3+4 = 77 Max Profit = put + call = 3+4 = 7
 Short call (out of money) example price = 65 Jan70C = 4 Jan60P = 3 Downside BE = Sp - put - call = = 53 Upside BE = Sc + put + call = = 77 Max Profit = put + call = 3+4 = 7")
79
same example price = 65 (price rises to 70) Jan70C = 4 Jan60P = 3Put falls to 1 Jan70P = 4 action: buy back the 60 put & sell the 70 put
 Jan70C = 4 Jan60P = 3Put falls to 1 Jan70P = 4 action: buy back the 60 put & sell the 70 put")
83
Short out of money put Long out of money call example (Bullish Strike Split) price = 53 Jan50P = 2 Jan60C = 1 BE = 48
 price = 53 Jan50P = 2 Jan60C = 1 BE = 48")
86
Short near term option Long distant term option example (Bull Calendar Spread) Price = 50 TodayApr50C = 5 short = +5 (Jan) July50C = 8 long = -8 Net Debit = -3 Price = 50 AprilApr50C = 0 July50C = 5
 Price = 50 TodayApr50C = 5 short = +5 (Jan) July50C = 8 long = -8 Net Debit = -3 Price = 50 AprilApr50C = 0 July50C = 5")
89
Price Apr50C/PLJuly50C/PLNet Profit 400/+500.5/-750-250 450/+5002.5/-550-50 480/+5004/-400+100 500/+5005/-300+200 522/+3006/-200+100 555/08/00 6010/-50010.5/+250+250

90
Same as call short near term & long distant term ex - price = 50, Jan50P = 2, Apr50P = 3

91
Opposite of all other common positions Example (Reverse ratio - backspread) 2:1 Short call @ s1 s1<s2 Long x calls @ s2 Price = 43 July40C = 4 July45C = 1
 2:1 Short s1 s1<s2 Long x s2 Price = 43 July40C = 4 July45C = 1")
92
Step 1

95
diff strikes & diff exp example (Diagonal Bull Spread) Price = 32 Apr30C = 3 Apr35C = 1 July30C = 4Long July30C July35C = 1.5Short Apr35C Normal Bull Spread -Long Apr30C Short Apr35C
 Price = 32 Apr30C = 3 Apr35C = 1 July30C = 4Long July30C July35C = 1.5Short Apr35C Normal Bull Spread -Long Apr30C Short Apr35C")
Similar presentations


 -Debit Spread -Shorter Term Trade (1 – 3 weeks before.>")


