Download presentation
Presentation is loading. Please wait.

1
Some reasons we don’t! Peter Weber The views contained herein are those of the author, not SeaRiver Maritime, Inc., or any of its affiliates.

2
Recent Headlines

12
Impediments to One Voice Differences of opinion in the various marine segments –Oceangoing, coastal, inland –Tanker, container, bulk, passenger, ferry –Owners, operators, charterers, financiers, insurers –Service providers, class societies, vendors, regulators Unaligned economic drivers –Charterer pays for fuel; operator pays for fuel –Customer considerations Varying regulatory influences –International, National, State, Local Desire to be ‘seen green’ –Business strategy of some; not important to others –May set expectations for all Suitability of solutions across various vessel types

13
Root Causes Lack of understanding of the science behind an issue –The EPA and international counterparts have resources and funding well beyond that typically found in marine industry –Marine Industry ability to review and understand reports limited Lack of time and resources to investigate the facts –Environmental issues require the industry to reach outside –Capabilities, credentials and political leanings need vetting –Issues may move at rapid pace

14
Root Causes (cont’d) Media pressure –Industry often portrayed in negative light –Environmental articles dominated by untested progressive solutions –Urgency to ‘do something’ –‘Truth’ accepted with limited questioning –‘Green’ sells
 Media pressure –Industry often portrayed in negative light –Environmental articles dominated by untested progressive solutions –Urgency to ‘do something’ –‘Truth’ accepted with limited questioning –‘Green’ sells")
15
Root Causes (cont’d) © DNV/Making Waves Internal industry pressure setting the vision –Class society environmental divisions taking an out-in-front role –Vendors offering products and solutions –Expectations set before testing done CO2 EMISSIONS FROM SHIPPING – TECHNICAL AND OPERATIONAL OPTIONS FOR EMISSION REDUCTION Approved by: Henrik O. Madsen and Tor E. Svensen, DNV, Richard Sadler and Alan Gavin, Lloyd’s Register “Technical and operational measures are likely to enable shipping to reduce CO2 emissions per tonne-mile by 50% for ships being delivered in 2030, and by up to 70% for ships being delivered in 2050, compared to a 2008 baseline.”

16
Root Causes (cont’d) Lack of trust in motives of the industry –Uncaring, greedy image dominates –Input from e.g. oil companies automatically tainted; environmental NGO motives pure –Industry ‘bad actors’ haven’t helped Insufficient ‘political’ will to defend a position –Difficult to argue, for example, numbers of deaths and value of a life –Easily painted as ‘Luddite’, ‘denier’ or even ‘evil’

17
Root Causes (cont’d)
")
18
‘Negotiating with ourselves’ –Reluctant to be tough negotiators –Sensitive to ‘bullying’ and accusations of ‘foot-dragging’ –Regulation looks inevitable so propose what we can live with –But environmental groups never seem to stop - always seem to push for more London version of the Stockholm Syndrome –Center of international marine environmental regulations –Most of our Industry NGOs and some major companies are London based –Interact heavily with each other and IMO personalities Meetings, lunches, cocktail parties, award ceremonies –Issues often look different from further away

19
Resulting Headlines

20
What’s the Answer? Well, let’s hear from our other panelists!

21
Backup

22
Shore Power Science debatable –GHG - Depends on source of power; marginal kW must be from renewable source (wind, solar, hydroelectric) or nuclear –Pollution – may only transfer problem elsewhere –Only captures at-berth component Practicality varies – reasonable for liner trades (container vessels, passenger ships and ferries); difficult for tankers and bulk carriers Cost/Benefit – generally high compared to other solutions Industry Response - mixed
 or nuclear –Pollution – may only transfer problem elsewhere –Only captures at-berth component Practicality varies – reasonable for liner trades (container vessels, passenger ships and ferries); difficult for tankers and bulk carriers Cost/Benefit – generally high compared to other solutions Industry Response - mixed")
23
Shore Power example San Pedro Bay Clean Air Action Plan (CAAP) –Calls for shore power for new projects and lease renewals –Near ‘legacy’ item for POLA Director of the Port Industry Reaction Mixed –Some container and passenger vessels complying –Other container operators looking for alternatives and offsets (low sulfur fuel, speed reductions) –BP terminal in LB converted for two dedicated diesel-electric vessels – left impression all tankers could be readily converted –Tanker industry generally opposed – steam cargo systems on most tankers limit usefulness to hotel loads; most tankers not in dedicated trade; high voltage and 50/60Hz frequency issues; manifold location determines required location for non-hazardous area hookup; berths in deeper water - not at the shoreline
 –Calls for shore power for new projects and lease renewals –Near ‘legacy’ item for POLA Director of the Port Industry Reaction Mixed –Some container and passenger vessels complying –Other container operators looking for alternatives and offsets (low sulfur fuel, speed reductions) –BP terminal in LB converted for two dedicated diesel-electric vessels – left impression all tankers could be readily converted –Tanker industry generally opposed – steam cargo systems on most tankers limit usefulness to hotel loads; most tankers not in dedicated trade; high voltage and 50/60Hz frequency issues; manifold location determines required location for non-hazardous area hookup; berths in deeper water - not at the shoreline")
24
Fuel Sulfur Limits Amended MARPOL Annex VI at MEPC 57, April 2008 –Established new S limits for Global Cap and Emission Control Areas (ECA) Most industry NGOs supported keeping residual fuel in the mix INTERTANKO called for global low-sulfur distillate solution –Took the ‘green’ card; aligned nicely with environmental group objectives –Highlighted advantages in reduced pollution and eased workload on crew –But didn’t consult with other industry bodies Refining would need to make large capital investments; ‘chicken and egg’ scenario Independent tanker operators typically don’t pay the fuel bill Negative impact on GHG on ‘well-to-prop’ basis Large block of countries led by SA resisted large global cap reduction –During dinner break industry NGOs negotiated with environmental block; ignored SA block –After dinner; settlement announced – no more discussion Global Cap impacts refining industry; not clear refining will follow; ‘train wreck’ scenario in 2025 still possible –IPIECA warning MEPC 57/WP.7 paragraph 7.18
 Most industry NGOs supported keeping residual fuel in the mix INTERTANKO called for global low-sulfur distillate solution –Took the ‘green’ card; aligned nicely with environmental group objectives –Highlighted advantages in reduced pollution and eased workload on crew –But didn’t consult with other industry bodies Refining would need to make large capital investments; ‘chicken and egg’ scenario Independent tanker operators typically don’t pay the fuel bill Negative impact on GHG on ‘well-to-prop’ basis Large block of countries led by SA resisted large global cap reduction –During dinner break industry NGOs negotiated with environmental block; ignored SA block –After dinner; settlement announced – no more discussion Global Cap impacts refining industry; not clear refining will follow; ‘train wreck’ scenario in 2025 still possible –IPIECA warning MEPC 57/WP.7 paragraph 7.18")
25
Statement by IPIECA (MEPC 57/WP.7) 7.18 While the working group reached full agreement on all elements of the amended regulations on this issue, IPIECA drew the attention of the working group to the fact that the oil industry did not expect that sufficient fuel at 0.10% and 0.50% were expected to be available in all regions by the desired dates of 2015 and 2020, respectively. In the judgement of IPIECA, the data included in the report of the informal cross government/industry scientific group of experts supported this assessment. IPIECA also stated, that in their view, a global requirement of 0.50% was not supported by scientifically demonstrated needs, while it would incur significant additional energy and crude oil consumption as well as overall CO2 emissions. IPIECA therefore recommended to include an evaluation of further environmental needs in the 2018 review.

26
Fuel Sulfur Limits - Some Concerns with the Science Vessel routes and emissions Air models Sulfur deposition assumptions Health Impacts and estimate of mortalities –Extrapolation of one limited cancer study –Not done by toxicologists Value of Life –Premature mortality –$5.8M

27
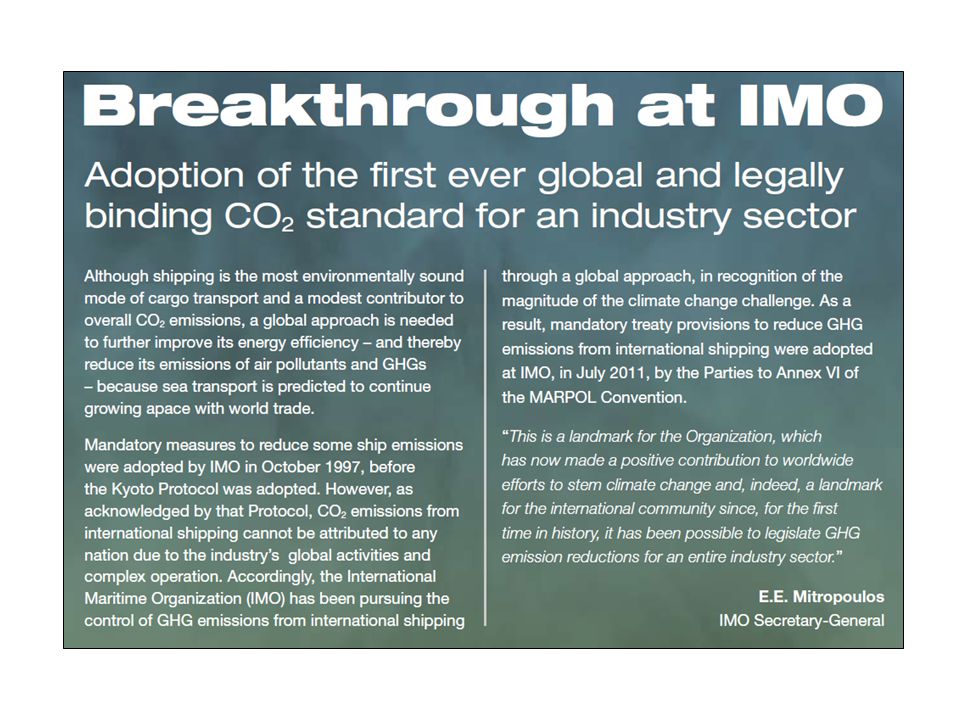
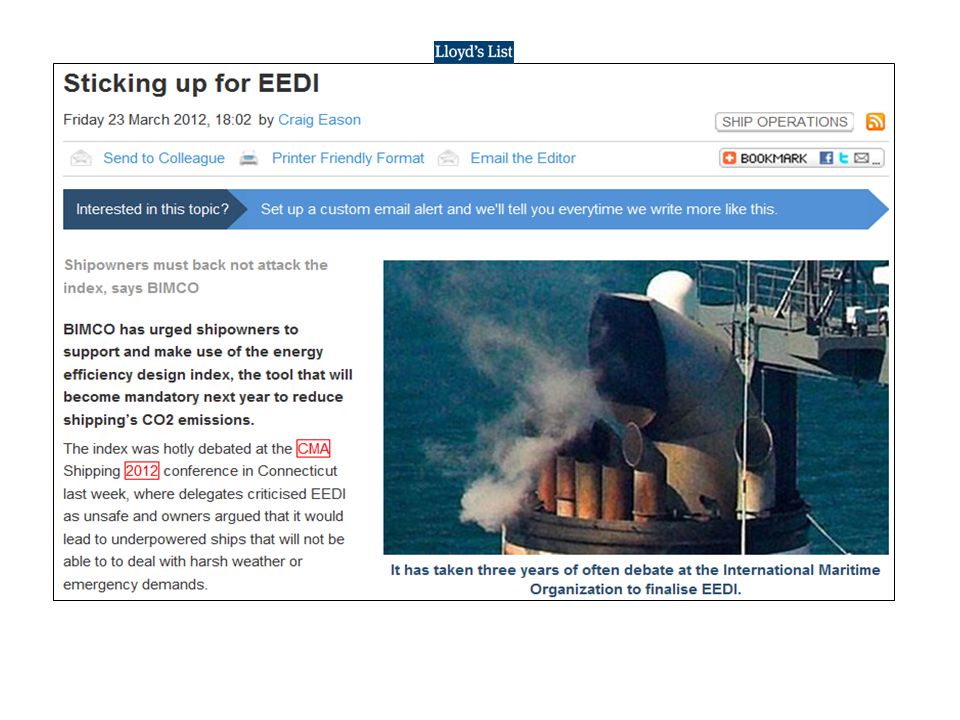
Greenhouse Gas Reduction Unless sufficient objection by July this year, will be regulated under new chapter of MARPOL Annex VI – Air Pollution from Ships –CO2 measure disguised as energy efficiency measure (GHG not a pollutant under the UN) –“First ever global and legally binding CO2 standard for an industry sector” –Conveniently by-passes direct Senate approval of an International Convention on GHG (The Maritime Pollution Prevention Act of 2008 (MPPA) gives the EPA and USCG authority to prescribe regulations to implement MARPOL Annex VI) Requires new ships to meet an increasingly stringent EEDI and existing ships to carry a SEEMP EEDI adopted in lieu of an MBM solution –Couldn’t reach MBM agreement due to CBDR argument –Outgoing IMO SG made clear passage a legacy item; had promised to the UN –Industry NGOs supported; fearful of environmental backlash, regional solutions –Insufficient discussion given to technical concerns – issues persist Large % reductions (10, 20 and 30% over 3 phases) Minimum power/reserve power requirements (EEDI proportional to speed squared) Regression curves Unique ship types, special uses, severe service
 – First ever global and legally binding CO2 standard for an industry sector –Conveniently by-passes direct Senate approval of an International Convention on GHG (The Maritime Pollution Prevention Act of 2008 (MPPA) gives the EPA and USCG authority to prescribe regulations to implement MARPOL Annex VI) Requires new ships to meet an increasingly stringent EEDI and existing ships to carry a SEEMP EEDI adopted in lieu of an MBM solution –Couldn’t reach MBM agreement due to CBDR argument –Outgoing IMO SG made clear passage a legacy item; had promised to the UN –Industry NGOs supported; fearful of environmental backlash, regional solutions –Insufficient discussion given to technical concerns – issues persist Large % reductions (10, 20 and 30% over 3 phases) Minimum power/reserve power requirements (EEDI proportional to speed squared) Regression curves Unique ship types, special uses, severe service")
28
Pete’s Suggestions Speak up – don’t be star-struck by organizations – they’re only people Re-engage with industry NGOs, ship owner/operator organizations and registers of major flag states Don’t let something begin at the IMO that you don’t think should proceed – once started it’s an unending bore-hole – it will only get worse (EEDI formula) Trust but verify – environmental reports may not tell the whole truth “Peer reviewed” is only as good as the “peers”
 Trust but verify – environmental reports may not tell the whole truth Peer reviewed is only as good as the peers")
Similar presentations