Download presentation
Presentation is loading. Please wait.

1
A Method for the More Accurate Measurement and Communication of Model Error Scott Fortmann-Roe University of California, Berkeley

2
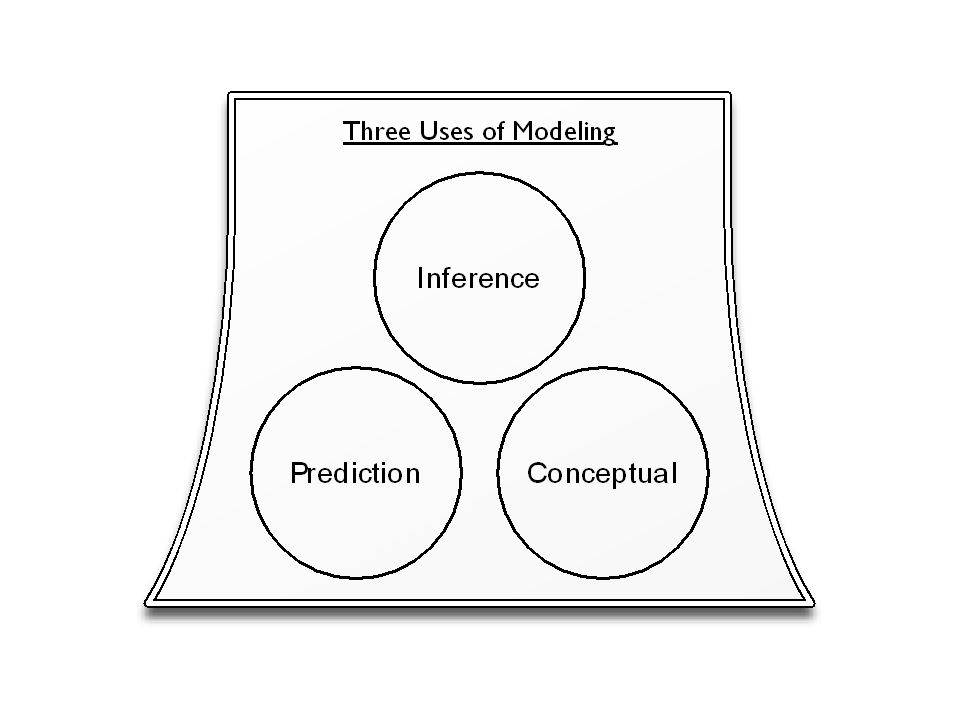
1) More accurate assessment of prediction error Predictions Inferences 2) More accurate models 3) More accurate measures of significance 4) Altered inferences and conclusions
 More accurate assessment of prediction error Predictions Inferences 2) More accurate models 3) More accurate measures of significance 4) Altered inferences and conclusions")
5
Issues with Current Approaches

6
Measure R 2, p- value, AIC AccuracyAccessibilityAdaptability

7
Measure Accuracy (R 2 ) AccessibilityAdaptability
 AccessibilityAdaptability")
8
House Area House Price

13
Measure Accuracy Accessibility (p-values) Adaptability
 Adaptability")
14
[Given a p-value from an experiment] you have found the probability of the null hypothesis being true. “
![[Given a p-value from an experiment] you have found the probability of the null hypothesis being true.](http://images.slideplayer.com/12/3376167/slides/slide_14.jpg ".")
15
Measure AccuracyAccessibility Adaptability (AIC, BIC, …)
")
16
The Method: A 3

17
Does X significantly affect Y? Does the inclusion of X in a model increase our ability to predict Y?

18
High-Level Statistical Overview Wraps around any predictive algorithm Linear Regression, Logistic Regression, Random Forests, … Cross-validation is used to obtain accurate measure of error Exact test is used to obtain accurate p-values No parametric assumptions (other than independence between observations) (Even independence may be violated if compensated for)
 (Even independence may be violated if compensated for)")
20
Applications

21
Housing Market Predicting housing price based on house and market attributes Harrison D, Rubinfeld DL (1978) Hedonic housing prices and the demand for clean air. Journal of Environmental Economics and Management 5: 81–102.

22
Coefficient Std. Error t-Valuep-Value (Intercept)7.7674.9891.5570.12 AGE-0.0150.014-1.0960.27 ROOMS7.0060.41217.015< 0.01 NOX-13.3143.903-3.412< 0.01 PUPIL/ TEACHER -1.1160.148-7.544< 0.01 HIGHWAY-0.0250.043-0.5840.56 Adjusted R 2 : 0.60; p-Value < 0.01
 AGE ROOMS < 0.01 NOX < 0.01 PUPIL/ TEACHER < 0.01 HIGHWAY Adjusted R 2 : 0.60; p-Value <")
23
CoefficientCrVa R 2 p-Value -Full Model- 59.3 %< 0.01 (Intercept)7.767- 0.1 %0.39 AGE-0.015+ 0.0 %0.22 ROOMS7.006+ 22.9 %< 0.01 NOX-13.314+ 0.8 %< 0.01 PUPIL/ TEACHER -1.116+ 4.6 %< 0.01 HIGHWAY-0.025- 0.2 %1.00 A 3 : Linear Model
 %0.39 AGE %0.22 ROOMS %< 0.01 NOX %< 0.01 PUPIL/ TEACHER %< 0.01 HIGHWAY %1.00 A 3 : Linear Model")
25
CrVa R 2 p-Value -Full Model-74.3 %< 0.01 AGE- 1.5 %0.01 ROOMS+ 20.4 %< 0.01 NOX+ 6.3 %< 0.01 PUPIL/ TEACHER - 1.4 %< 0.01 HIGHWAY- 2.6 %0.03 A 3 : Random Forest Model

26
Linear Regression Random Forest Support Vector Machines CrVa R 2 0.5930.7430.711 Significant at p = 0.05 ROOMS NOX PUPIL/TE ACHER AGE ROOMS NOX PUPIL/TE ACHER HIGHWAY AGE ROOMS NOX PUPIL/TE ACHER Not Significant at p = 0.05 AGE HIGHWAY

27
Environmental Productivity Measure utility of an ecosystem based on different physical attributes Maestre FT, Quero JL, Gotelli NJ, Escudero A, Ochoa V, et al. (2012) Plant Species Richness and Ecosystem Multifunctionality in Global Drylands. Science 335: 214–218.
 Plant Species Richness and Ecosystem Multifunctionality in Global Drylands. Science 335: 214–218..")
28
CoefficientStd. Errort-Valuep-Value (Intercept)1.00800.1755.772< 0.01 SR0.00990.0042.3510.02 SLO0.01760.0063.139< 0.01 SAC-0.01740.002-8.523< 0.01 C1-0.02090.039-0.5370.59 C2-0.06770.053-1.2850.20 C30.03480.0360.9790.33 C4-0.26630.038-7.005< 0.01 LAT0.00240.0011.7970.07 LONG-0.00190.001-3.474< 0.01 ELE-0.00020.000-3.887< 0.01 Adjusted R 2 =0.56; p-Value < 0.01
 < 0.01 SR SLO < 0.01 SAC < 0.01 C C C C < 0.01 LAT LONG < 0.01 ELE < 0.01 Adjusted R 2 =0.56; p-Value <")
29
CoefficientCrVa R 2 p-Value -Full Model- 52.5 %< 0.01 (Intercept)1.008+ 7.2 %< 0.01 SR0.010+ 0.8 %0.01 SLO0.018+ 1.7 %0.01 SAC-0.017+ 16.3 %< 0.01 C1-0.021- 0.5 %0.91 C2-0.068+ 0.0 %0.15 C30.035- 0.2 %0.28 C4-0.266+ 10.8 %< 0.01 LAT0.002+ 0.2 %0.09 LONG-0.002+ 2.4 %< 0.01 ELE0.000+ 3.0 %< 0.01 A 3 : Linear Model
 %< 0.01 SR %0.01 SLO %0.01 SAC %< 0.01 C %0.91 C %0.15 C %0.28 C %< 0.01 LAT %0.09 LONG %< 0.01 ELE %< 0.01 A 3 : Linear Model")
30
CrVa R 2 p-Value -Full Model-68.3 %< 0.01 SR+ 1.2 %< 0.01 SLO- 1.3 %0.95 SAC+ 4.0 %< 0.01 C1+ 1.8 %< 0.01 C2- 0.04 %0.02 C3+ 0.3 %0.16 C4+ 0.6 %< 0.01 LAT+ 0.5 %< 0.01 LONG+ 0.2 %0.02 ELE+ 0.4 %0.02 A 3 : Random Forest Model

32
Applications Recap Explained an additional 15-16% of the squared error Significantly altered inferences and conclusions about the underlying systems

33
Summary

34
MethodAccuracyAccessibilityAdaptability R2R2 ★☆☆ ★★★ Adjusted R 2 ★★☆★★★★☆☆ p-Values ★★★★★☆ AIC, BIC and Information Theoretic Techniques ★★★★☆☆★★☆ A3A3 ★★★

36
Questions….

Similar presentations


 R2 statistic (Ch. 8.6.2) Association is not causation (Ch. 7.5.3) Next.>")


