Download presentation
Presentation is loading. Please wait.

1
Economic Profile: Region 10 Uric Dufrene Sanders Chair in Business IU Southeast

2
Outline Demographics Commuting patterns Employment and labor force Compensation Retail sales activity Historical long term growth Recent economic performance

3
DEMOGRAPHICS

4
Region 10 Crawford Clark Floyd Harrison Scott Washington

5
Population over Time Number Rank in State Percent of StateIndiana Yesterday (2000)262,546104.30%6,080,485 Today (2009)282,672104.40%6,417,276 Tomorrow (2015 projection) 289,059104.40%6,581,875 Percent Change 2000 to Today 7.70%2 5.50% Population Region 10 Source: STATS Indiana
262, %6,080,485 Today (2009)282, %6,417,276 Tomorrow (2015 projection) 289, %6,581,875 Percent Change 2000 to Today 7.70%2 5.50% Population Region 10 Source: STATS Indiana")
6
Population by Age Region 10 Population Estimates by Age, 2009 NumberRank of 11 Pct Dist. in Regionin State Preschool (0 to 4)18,15596.40%6.90% School Age (5 to 17)48,765917.30%17.80% College Age (18 to 24)22,498118.00%10.00% Young Adult (25 to 44)77,387927.40%26.30% Older Adult (45 to 64)78,609927.80%26.00% Seniors (65 and older)37,1011013.10%12.90% Source: STATS Indiana
18, %6.90% School Age (5 to 17)48, %17.80% College Age (18 to 24)22, %10.00% Young Adult (25 to 44)77, %26.30% Older Adult (45 to 64)78, %26.00% Seniors (65 and older)37, %12.90% Source: STATS Indiana.")
7
Race and Ethnicity Region 10 Population Estimates by Race and Hispanic Origin, 2009 NumberRank of 11 Pct Dist. in Regionin State American Indian or Alaska Native Alone 695100.20%0.30% Asian Alone1,770110.60%1.50% Black Alone12,71584.50%9.20% Native Hawaiian and Other Pac. Isl. Alone 105100.00%0.10% White263,9631093.40%87.80% Two or More Race Groups3,26791.20% Hispanic or Latino Origin (can be of any race) Non-Hispanic276,0191097.70%94.50% Hispanic6,49682.30%5.50% Source: STATS Indiana
 Non-Hispanic276, %94.50% Hispanic6, %5.50% Source: STATS Indiana.")
8
Household Types Region 10 Household Types NumberRank of 11 Pct Dist. in Regionin State Households in 2009 (includes detail not shown below) 110,60610100.00% Married With Children22,5981120.40%21.20% Married Without Children34,7271031.40%29.80% Single Parents11,48610.40%9.80% Living Alone29,357926.50%27.30% Source: STATS Indiana
 110, % Married With Children22, %21.20% Married Without Children34, %29.80% Single Parents11, %9.80% Living Alone29, %27.30% Source: STATS Indiana.")
9
Income and Poverty Region 10 Income and Poverty NumberRank of 11 Percent of StateIndiana Per Capita Personal Income (annual) in 2009 $32,615495.90%$34,022 Welfare (TANF) Monthly Average Families in 2010 1,39574.50%30,864 Food Stamp Recipients in 2010 35,48894.30%829,907 Free and Reduced Fee Lunch Recipients in 2009 18,93294.30%436,945 Source: STATS Indiana
 in 2009 $32, %$34,022 Welfare (TANF) Monthly Average Families in , %30,864 Food Stamp Recipients in , %829,907 Free and Reduced Fee Lunch Recipients in , %436,945 Source: STATS Indiana")
10
School Enrollments Region 10 Source: STATS Indiana

11
IN=19.4% (BS)
")
12
COMMUTING PATTERNS

13
Clark Commuting Source: STATS Indiana

14
Floyd Commuting Source: STATS Indiana

15
Washington Commuting Source: STATS Indiana

16
Harrison Commuting Source: STATS Indiana

17
Crawford Commuting Source: STATS Indiana

18
Scott Commuting Source: STATS Indiana

19
EMPLOYMENT AND LABOR FORCE

20
Labor Force Distribution 2011

21
Payrolls by County 2010 Q4

22
Region 10 Payrolls

23
Source: Bureau of Labor Statistics

24
Non Farm Payrolls Recession Start to Now Source: STATS Indiana

25
Non Farm Payroll Levels Region 10 Source: STATS Indiana

27
COMPENSATION

28
Total Compensation Source: STATS Indiana

29
Total Compensation Per Job Source: STATS Indiana

30
Change in Compensation Per Job Source: STATS Indiana

31
RETAIL SALES ACTIVITY

32
Retail Sales, Region 10 Source: STATS Indiana

33
Retail Sales by County Source: STATS Indiana

35
LONG TERM GROWTH

36
Shift Share Analysis Allows us to determine county performance of specific sectors, relative to the nation and industry. Does the area enjoy any local competitive advantage?

37
Georgiastats.uga.edu

38
Did not keep pace by county 1999 to 2009 Georgiastats.uga.edu

39
RECENT ECONOMIC PERFORMANCE

41
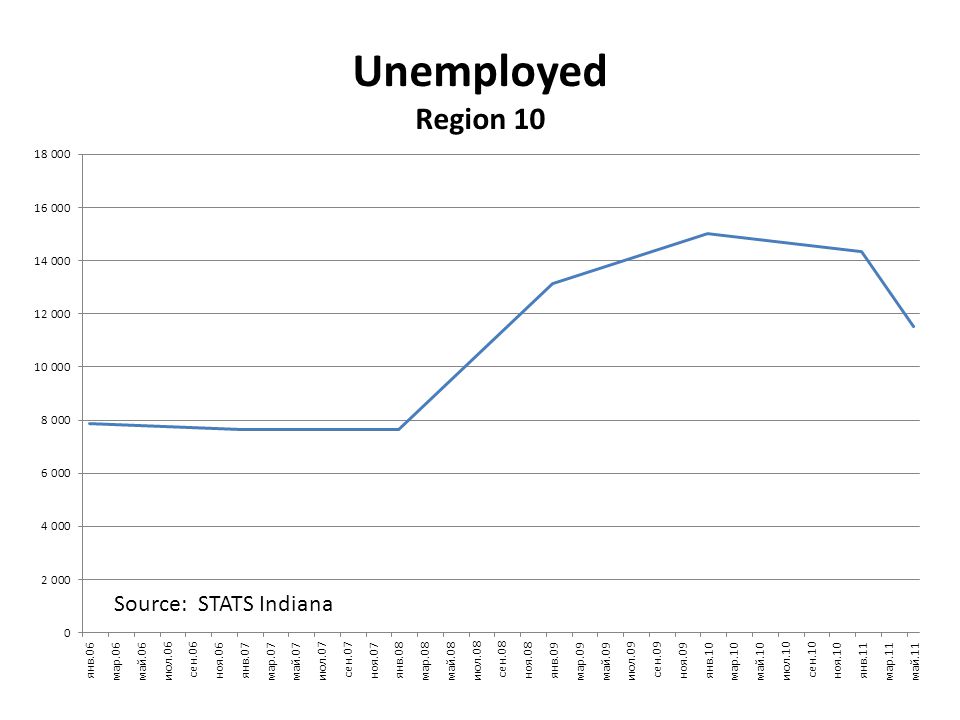
Source: STATS Indiana

46
LOUISVILLE METRO

47
Unemployment Rates

48
Louisville Metro Payrolls Year on Year

49
Payrolls: National and L’ville (blue) Year over year Percent Change
 Year over year Percent Change")
50
Consumer Confidence and L’ville Employment(red)
")
51
Auto Sales Picking Up ?

52
More cars, More employment for Louisville (red)
")
53
Durable Goods Orders

54
Durable Goods and L’ville Employment (red)
")
55
National Manufacturing Index Louisville Employment (blue)
")
56
Thank You udufrene@ius.edu

Similar presentations


>")


