Download presentation
Presentation is loading. Please wait.

1
Dealing with Uncertainty in Cost-Effectiveness Analyses
Gerald F. Kominski, Ph.D. Professor, Department of Health Services

2
CE Ratios: Decision Rules
IV C> 0, E<0 => CE<0 never adopt “dominated” C> 0, E>0 => CE>0 adopt if CE<CE(max) E II III C< 0, E<0 => CE>0 adopt only if savings is worth health cost C<0, E>0 => CE<0 always adopt “cost-saving” = dominates
 E. II. III. C< 0, E<0 => CE>0. adopt only if savings. is worth health cost. C<0, E>0 => CE<0. always adopt. cost-saving = dominates.")
3
Consider a New Therapy That Produces a 3-Fold Decrease in Mortality

4
ICER Comparing Treatments A and B
Treatment Cost Effectiveness A $6, B $10, B-A $4, ICER = $4,200 / = $35,156

5
Problems with Point Estimate of ICER
Does not express variability in the data May lead to the adoption of options that are <WTP threshold, even if the 95% CI exceeds the WTP threshold So, what are the options for dealing with the uncertainty of ICERs?

6
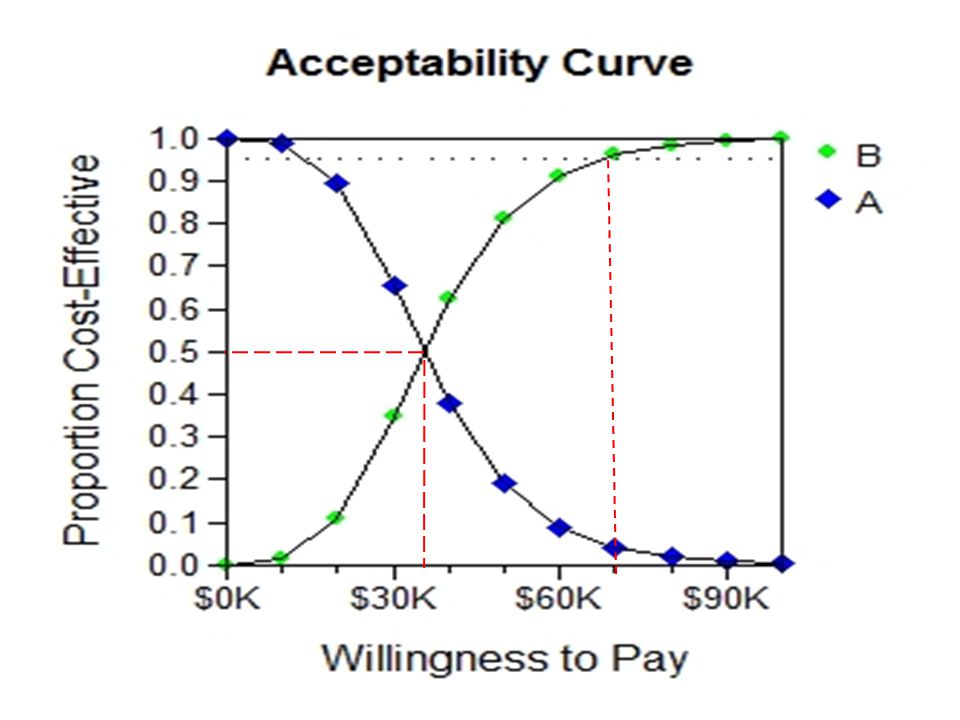
Dealing With Uncertainty
Confidence Intervals 95% CIs for ICERs 95% confidence ellipsoid Net Monetary Benefits Acceptability Curves Monte Carlo Simulations

7
Confidence Intervals

8
How to Calculate 95% CIs Fieller’s Theorem and bootstrap methods have been used by various researchers These methods work when ICERs are confined to one quadrant of the cost-effective plane (as in the previous slide) Bootstrap methods work even when ICERs are found in 2 or 3 of the 4 quadrants Fieller’s Theorem leads to results that are difficult to interpret when the effect difference is insignificant, or when there is no significant difference in costs or effect
 Bootstrap methods work even when ICERs are found in 2 or 3 of the 4 quadrants. Fieller’s Theorem leads to results that are difficult to interpret when the effect difference is insignificant, or when there is no significant difference in costs or effect.")
9
So, Are CIs Worth Calculating?
Probably not, unless your data are limited to one quadrant of the cost-effectiveness plane Since the early 2000s, researchers have generally abandoned calculation of 95% CIs in favor of alternative methods: Acceptability Curves and 95% Ellipsoids Net Monetary Benefits (NMB)
")
10
ICER Scatterplot and 95% Ellipsoid for Sample Data

11
ICER Scatterplot Data, by Component
Comp. Quadrant Incr. Eff. Incr. Cost ICER # Points Percent C1 IV IE>0 IC<0 Superior % C2 I IE>0 IC>0 < % C3 III IE<0 IC<0 > % C4 I IE>0 IC>0 > % C5 III IE<0 IC<0 < % C6 II IE<0 IC>0 Inferior 0 0%

12
Interpretation of ICER Scatterplot
What does the above table mean? Quadrants begin at "I" in the upper right, and increment counter-clockwise to "IV" in the lower right. To identify cost-effective points, a different component labeling system is used. Cost-effective points for "B" lie below the WTP line, in components 1-3. Component 1 (C1) is where the comparator is dominant ('Superior'). Component 2 (C2) is where the comparator is more costly, but lies below the WTP. Component 3 (C3) is where the comparator is less costly, but lies below the WTP. Component 4 (C4) is where the comparator is more costly, and lies above the WTP. Component 5 (C5) is where the comparator is less costly, and lies above the WTP. Component 6 (C6) is where the comparator is dominated ('Inferior').
 is where the comparator is dominant ( Superior ). Component 2 (C2) is where the comparator is more costly, but lies below the WTP. Component 3 (C3) is where the comparator is less costly, but lies below the WTP. Component 4 (C4) is where the comparator is more costly, and lies above the WTP. Component 5 (C5) is where the comparator is less costly, and lies above the WTP. Component 6 (C6) is where the comparator is dominated ( Inferior ).")
14
Net Monetary Benefits Net Monetary Benefits are based on the maximum ICER or WTP : ICER (max) or WTP = DC / DE > 0 {WTP * DE} – DC > 0 Less commonly expressed as Net Health Benefits: {DC / WTP} – DE > 0

15
Slope = DE

16
How Do We Generate These Measures of Variability?
If you have individual level data, you can calculate variability directly from the study data If you are conducting a cost-effectiveness analysis using published or aggregate data, you need to either: Have data on the variability for each key variable, or Estimate the variability in each key variable

17
Monte Carlo Simulations
If you don’t have individual level data, you can simulate the variability in key variables using Monte Carlo techniques Monte Carlo simulation is a parametric technique, so it requires that you either know or guess the type of distribution each key variable comes from Nonparametric bootstrapping can be used if you have individual level data TreeAge can produce Monte Carlo simulations, once you specify variable distribution, means, and standard deviations More about how to do this in the Lab session

Similar presentations


 of representative samples or strength parameters or slope.>")


 1. Directly measure the variable. - referred.>")


>")


 Professor André Farber Solvay Business School Université Libre de Bruxelles Fall 2007.>")


 Samer Kharroubi Centre for Bayesian.>")