Download presentation
Presentation is loading. Please wait.

2
MODULE 3: LESSON 1 LMI AND STRATEGIC PLANNING This project has been funded, either wholly or in part, with Federal funds from the Department of Labor, Employment & Training Administration under Task Order Number DOLJ061A20373; the mention of trade names, commercial products, or organizations does not imply endorsement of same by the U.S. Government. U.S. Department of Labor—Employment & Training Administration| Missouri Economic Research and Information Center| Missouri Department of Economic Development

3
Today’s Lesson Module 1:Labor Market Information Fundamentals Module 2:Skill Assessments & Career Pathway Planning Module 3:Using Economic & Workforce Data to Drive Reemployment Strategy Lesson 1: LMI and Strategic Planning Lesson 2: LMI and Re-Employment Module 4:Guiding Businesses/Partners to Use Workforce System & LMI Resources to Support Human Resource Functions

4
What’s In It For Me? This 20-minute module will enable you to: Identify LMI sources for the strategic planning process Use data to develop effective strategies for economic recovery Retrieve relevant data from key LMI Sources 1. Local Employment Dynamics (LED), Industry Focus 2. Quarterly Census of Employment and Wages 3. State Industry Projections
, Industry Focus 2. Quarterly Census of Employment and Wages 3. State Industry Projections.")
5
Strategic Planning Building a dynamic Strategic Plan starts with: Current Conditions, and Trend Analysis. Where are we? Where are we going? Can we or should we change directions?

6
Data for Decision Makers

7
LMI Value to Businesses Key quick-stop LMI sites targeting the dynamic needs of businesses LED Industry Focus QCEW Location Quotient MERIC Industry Projections

8
Local Employment Household Dynamics-LEHD Based on Industry Classifications – NAICS (up to 4-digit) Searchable by Geography and/or Industry Industry Employment information is inclusive of all Occupations within each Industry. Where to Find—LEHD Data

9
LED Quarterly Workforce Indicators Quickly report activity by quarter or change over time (1995 – 2009). Based on Worker Demographics: Age Group Gender Organized by Geographies: WIA Metro County Available to a 4-Digit NAICS Specificity 1. Total Employment 2. Net Job Flows 3. Job Creation 4. New Hires 5. Separations 6. Turnovers 7. Average Monthly Earnings 8. Average New Hire Earnings Customized SearchesWorkforce Indicators

10
LED Quarterly Workforce Indicators 1. Total Employment 2. Net Job Flows 3. Job Creation 4. New Hires 5. Separations 6. Turnovers 7. Average Monthly Earnings 8. Average New Hire Earnings Workforce Indicators 1.Who is filling what jobs? 2.What industries are the biggest employers? 3.What industries employ the largest number of a particular type of worker?

11
LED Quarterly Workforce Indicators 1. Total Employment 2. Net Job Flows 3. Job Creation 4. New Hires 5. Separations 6. Turnovers 7. Average Monthly Earnings 8. Average New Hire Earnings Workforce Indicators 1.Which industries are expanding employment? 2.Which industries are contracting employment?

12
LED Quarterly Workforce Indicators 1. Total Employment 2. Net Job Flows 3. Job Creation 4. New Hires 5. Separations 6. Turnovers 7. Average Monthly Earnings 8. Average New Hire Earnings Workforce Indicators 1.What industries are hiring the most workers? 2.Which industries are hiring older workers? 3.Which industries are hiring women? 4.What geographic areas are doing the most hiring?

13
LED Quarterly Workforce Indicators 1. Total Employment 2. Net Job Flows 3. Job Creation 4. New Hires 5. Separations 6. Turnovers 7. Average Monthly Earnings 8. Average New Hire Earnings Workforce Indicators 1.What workers are leaving jobs? 2.What industries are workers leaving?

14
LED Quarterly Workforce Indicators 1. Total Employment 2. Net Job Flows 3. Job Creation 4. New Hires 5. Separations 6. Turnovers 7. Average Monthly Earnings 8. Average New Hire Earnings Workforce Indicators IMPORTANT NOTE QWI measures do not include the number of hours or weeks an employee worked. This affects the interpretation of the measure of average earnings. Similarly, high fourth quarter monthly earnings in some industries may reflect end- of-year bonuses and apparently high earnings for older workers may reflect one- time disbursements as they retire.

15
LEHD Data by Industry

19
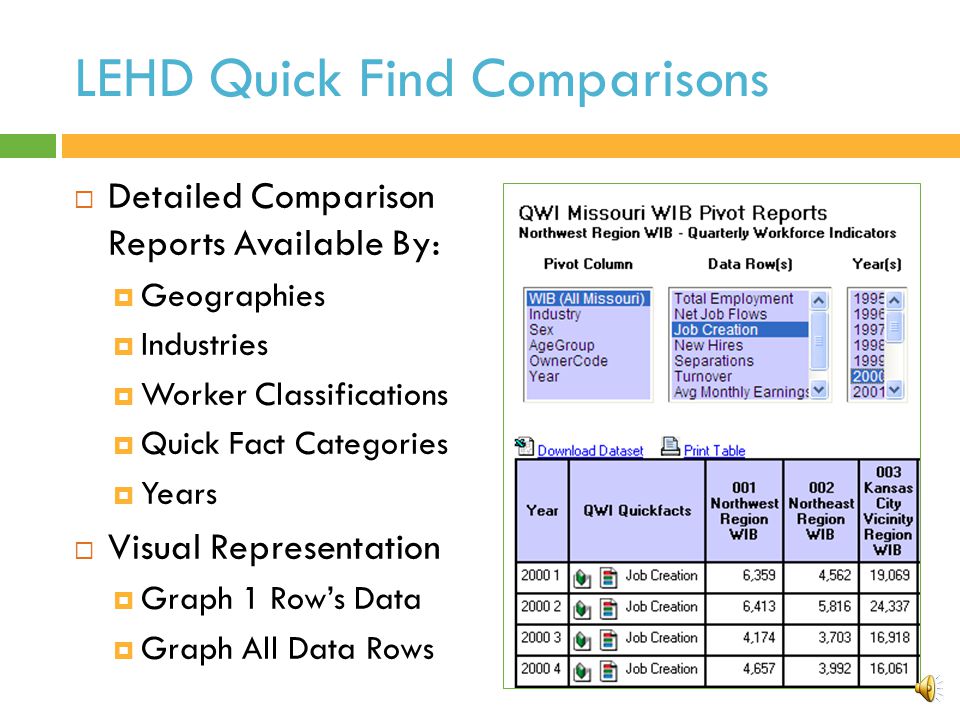
LEHD Quick Find Comparisons Detailed Comparison Reports Available By: Geographies Industries Worker Classifications Quick Fact Categories Years Visual Representation Graph 1 Row’s Data Graph All Data Rows

20
LED Industry Focus Quickly report the top industries for an area. Based on Worker Demographics: Age Group Gender Organized by Geographies: State WIA Metro County Specific to Industry Sectors 1. Employment 2. Growth in Employment 3. Growth in Hiring 4. Number of New Hires 5. Firm Job Change 6. Average Monthly Earning for All Workers 7. Growth in Average Monthly Earning for All Workers 8. Average Monthly Earning for New Hires Customized SearchesIndustry Indicators

22
Curious, after the state-wide commitment of $1 million to commemorate the centennial of Mark Twain’s death, what changes has the Arts, Entertainment and Recreation industry seen in the Northeast WIA region? Was it a positive impact and something that should be duplicated in the future for similar projects? Case Study Industry Focus - In Action

23
Current Conditions/Trend Analysis

24
Focused Industry Look Northeast WIA Q4 08 – Q3 09 Arts, Entertainment, Recreation Ranked 25 th in average quarterly employment RankNAICS subsectors Employment 1722 Food Services and Drinking Places 5,769 2623 Nursing and Residential Care Facilities 4,102 3541 Professional, Scientific, and Technical Services 2,502 4621 Ambulatory Health Care Services 2,476 5445 Food and Beverage Stores 2,415 6452 General Merchandise Stores 2,052 7447 Gasoline Stations 1,920 8522 Credit Intermediation and Related Activities 1,881 9238 Specialty Trade Contractors 1,752 10622 Hospitals 1,751 11561 Administrative and Support Services 1,510 12331 Primary Metal Manufacturing 1,501 13423 Merchant Wholesalers, Durable Goods 1,377 14311 Food Manufacturing 1,342 15484 Truck Transportation 1,341 16624 Social Assistance 1,329 17336 Transportation Equipment Manufacturing 1,316 18424 Merchant Wholesalers, Nondurable Goods 1,218 19237 Heavy and Civil Engineering Construction 1,173 20444 Building Material, Garden Equipment, Supplies Dealers 1,106 21551 Management of Companies and Enterprises 1,089 22611 Educational Services 1,076 23327 Nonmetallic Mineral Product Manufacturing 1,049 24441 Motor Vehicle and Parts Dealers 1,034 25713 Amusement, Gambling, and Recreation Industries 987

25
Current Conditions/Trend Analysis

26
Trend Analysis – Industry Location Quotient An area’s distribution or concentration of employment by industry Employment i,r Employment r Employment i,n Employment n / = LQ What Does the Location Quotient (LQ) Mean? Low Employment GrowthHigh Employment Growth High LQImportant industries that may require attention Important growth industries Low LQIndustries with lower potential for local economy Potential emerging industries LQ Formula

27
Location Quotient – Snapshot Biomedical Cluster of Missouri and North Carolina Compared to the United States Employment Concentrations Next Steps Quarterly industry comparison for change over time Biomedical Device IndustryMissouriNorth Carolina Base Industry: Total, all industries 1.00 322291 Sanitary paper product mfg. ND0.56 325411 Medicinal and botanical mfg. 2.42ND 325412 Pharmaceutical preparation mfg. 0.662.42 325413 In-vitro diagnostic substance mfg. 0.46ND 325414 Other biological product mfg. 1.305.94 325620 Toilet preparation mfg. 0.632.34 33451 Electronic instrument mfg. 0.240.78 334510 Electromedical apparatus mfg. 0.030.42 334514 Totalizing fluid meters and counting devices 0.070.46 334516 Analytical laboratory instrument mfg. 0.190.49 334517 Irradiation apparatus mfg. ND 33911 Medical equipment and supplies mfg. 0.790.89 339111 Laboratory apparatus and furniture mfg. NC 339112 Surgical and medical instrument mfg. 1.180.98 339113 Surgical appliance and supplies mfg. 0.331.10 339114 Dental equipment and supplies mfg. 0.47ND 339115 Ophthalmic goods mfg. 0.34ND 339116 Dental laboratories 1.170.84 541380 Testing laboratories 0.510.73 541710 Physical, engineering and biological research NC *As indentified in 2008 by the EDA University Center for Economic Development at Clemson University.

28
State Employment Projections 1. Trend Analysis – Industry Employment 2. Project Industry Employment 2 & 10 Years Out 3. Analyze Staffing Patterns – Occupational Employment within Industries 4. Obtain Occupational Employment Projections by Applying Staffing Patterns to Base & Projected Year Industry Employment Sample BioMedical Industry Employment Projections EmploymentChange 200820182008-2018 NAICSTitleEstimatedProjectedNumericPercent 322200Converted Paper Product Mfg.8,4106,780-1,635-19.4% 325600Soap, Cleaning Compound, and Toilet Preparation Mfg.3,4703,360-104-3.2% 339100Medical Equipment and Supplies Mfg.4,5005,22072316.0% 541300Architectural, Engineering, and Related Services23,66023,8001400.6% 541700Scientific Research and Development Services10,28012,8802,60025.3%

29
Module 3 – Lesson 1 Complete Module A:Labor Market Information Fundamentals Module 1: Utilizing LMI to Help Job Seekers Make Career Decisions Module 2:Using Data to Inform Skill Assessment, Competency Analysis & Career Pathway Planning Module 3:Using Economic & Workforce Data to Drive Reemployment Strategy Lesson 1: LMI and Strategic Planning Lesson 2: LMI and Re-Employment Module 4:Guiding Businesses/Partners to Use Workforce System & LMI Resources to Support Human Resource Functions

30
Thank you for your participation!

31
http://www.surveymonkey.com/s/M7BLRV9 Please take a moment to complete this survey, which is available online at the link below. Your input will assist us in making these webinars more effective and successful as we continue to make further improvements.

Similar presentations


 Colleen D. Flannery New Jersey State Data Center June 11,>")
 Online Toolset For the Workforce Information in Regional Economic Development Conference ETA Regions 4 and 6, Phoenix,>")


 Industry Employment Projection Report: 2010-2020 EmploymentProjected Change.>")


 and Cornell University Economic and Demographic Report.>")


