Download presentation
Presentation is loading. Please wait.

1
1

2
N IGERIA ’ S R EVENUE R EALITIES – 2011 Profile – Structure – Puzzles – Clues

3
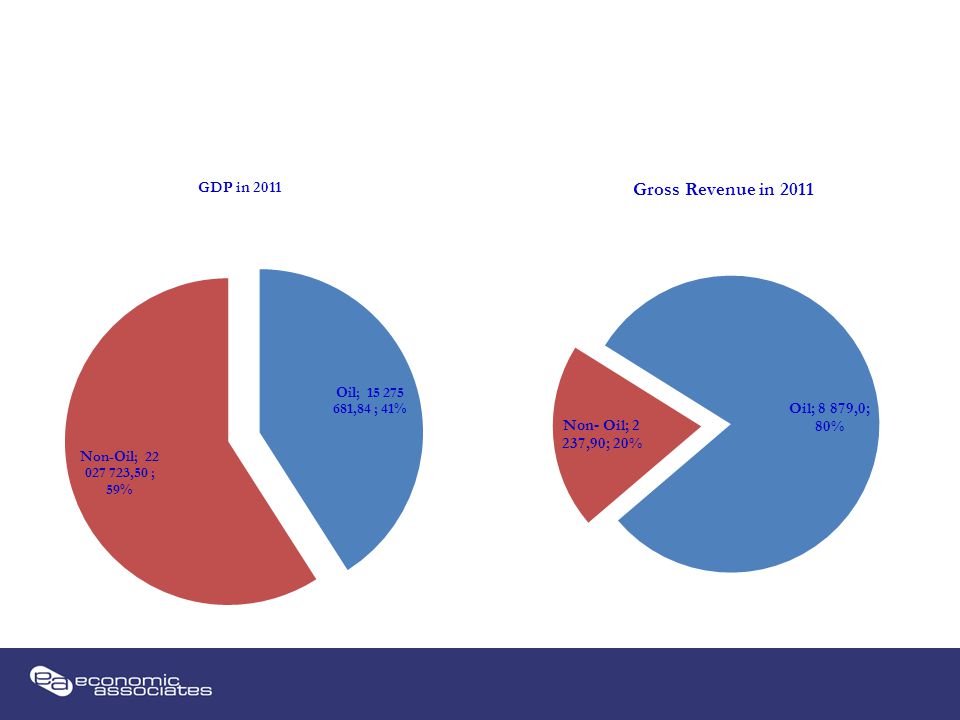
2011 PROFILE GDP in 2011N37 trillion Oil GDPN15 trillion Non-OilGDP N22 trillion Federally Collected Revenue in 2011N11.116 trillion (Gross), N5.085 trillion (Net) Oil Revenue N8,879 (Gross), N4.015 (Net) Non-Oïl Revenue N2.237 (Gross) N2.143 (Net) Less: Transfers (to VAT Pool, etc)N1.073 trillion Federally Distributable PoolN7.565.3 trillion Statutory AllocationsN5.085 Excess CrudeN1.856 trillion VAT PoolN623.5 billion DistributionN7.565.3 trillion Federal GovernmentN3.334 trillion State GovernmentN1.970 trillion Local GovernmentN1.497 trillion 13% DerivationN763 billion
, N5.085 trillion (Net) Oil Revenue N8,879 (Gross), N4.015 (Net) Non-Oïl Revenue N2.237 (Gross) N2.143 (Net) Less: Transfers (to VAT Pool, etc)N1.073 trillion Federally Distributable PoolN trillion Statutory AllocationsN5.085 Excess CrudeN1.856 trillion VAT PoolN623.5 billion DistributionN trillion Federal GovernmentN3.334 trillion State GovernmentN1.970 trillion Local GovernmentN1.497 trillion 13% DerivationN763 billion")
4
STRUCTURE Oil Revenue (Gross)N8.879 trillion Crude Oil / Gas ExportsN2.287 trillion PPT and Royalties etc.N3.976.30 trillion Domestic Crude Oil SalesN2.608.80 trillion Other Oil RevenueN6.0 Less: Deductions 3/4,863.60N Oil Revenue (Net)N4.015 trillion Non- Oil RevenueN2,237 trillion Corporate TaxN700 billion Customs & Excise DutiesN438.3 billion Value-Added Tax (VAT)N649.5 billion FG Independent RevenueN182.5 billion Education TaxN101.7 billion Custom LeviesN156.8 billion Nat. Inf. Tech Dev. Fund (NITDF)N8.6 billion Less: Deductions 3/ N94.9 billion Non- Oil Revenue (Net)2.143 trillion
N8.6 billion Less: Deductions 3/ N94.9 billion Non- Oil Revenue (Net)2.143 trillion.")
5
STRUCTURE Oil Revenue (Gross)N8.879 trillion Crude Oil / Gas ExportsN2.287 trillion PPT and Royalties etc.N3.976.30 trillion Domestic Crude Oil SalesN2.608.80 trillion Other Oil RevenueN6.0 Less: Deductions 3/4,863.60N Oil Revenue (Net)N4.015 trillion Non- Oil RevenueN2,237 trillion Corporate TaxN700 billion Customs & Excise DutiesN438.3 billion Value-Added Tax (VAT)N649.5 billion FG Independent RevenueN182.5 billion Education TaxN101.7 billion Custom LeviesN156.8 billion Nat. Inf. Tech Dev. Fund (NITDF)N8.6 billion Less: Deductions 3/ N94.9 billion Non- Oil Revenue (Net)2.143 trillion
N8.6 billion Less: Deductions 3/ N94.9 billion Non- Oil Revenue (Net)2.143 trillion.")
8
FGStatesLGsFederation Total Revenue 3,553.503,410.101,603.808,567.40 Total Expenditure 4,712.103,542.001,601.209,855.30 o Recurrent Expenditure 3,314.502,055.801,179.406,549.70 Personel 1,722.40680.2748.13,150.70 Overhead 673.3484.9231.71,389.90 Pensions 131.585.1-216.60 Debt Charges 527.2232.2-759.40 o Current Balance 239.001,354.30424.402,017.70 o Capital Expenditure 918.51,375.20421.82,715.50 Overall Overall Balance -1,158.60-131.902.60-1,287.90

10
Economic Associates, 16 Amodu Ojikutu Street, P.O. Box 70909, Victoria Island, Lagos, Nigeria. Tel: 234 1 461 0800-5; e-mail info@econassociates.com; home page http://www.econassociates.cominfo@econassociates.comhttp://www.econassociates.com We provide our clients with facts on the trends and outlook of risks and opportunities in the Nigerian economy, given the realities of the international economic situation, and the economic policy directions of the government. Our products and services currently include: Economic Outlook monthly summaries of the main drivers of Nigerian economic outlook. Data & Forecasts monthly forecasts on over 200 Nigerian economic and financial variables. Economic Model for analyzing impacts of global, national and industry shocks in-house. Executive Briefing provides decision-makers discussions of the drivers of the economic outlook. Management Training provides detailed training on selected topics on the Nigerian economy. Retainer Services provide regular access to EA staff to discuss new ideas as they emerge. About EA 10

Similar presentations


>")


 Updated January 27, 2014 Katie Powell, CPA and Yulia Sharapova-Leamy,>")

