Download presentation
Presentation is loading. Please wait.

1
RL-RC Circuits & Applications SVES Circuits Theory

2
Introduction In this chapter, phasor algebra will be used to develop a quick, direct method for solving both the series and the parallel ac circuits. Describe the relationship between current and voltage in an RC & RL circuits Determine impedance and phase angle in RC and RL circuits 2

3
Impedance and the Phasor Diagram
Resistive Elements Use R=0° in the following polar format to ensure the proper phase relationship between the voltage and the current resistance: The boldface Roman quantity ZR, having both magnitude and an associate angle, is referred to as the impedance of a resistive element. ZR is not a phasor since it does not vary with time. Even though the format R0° is very similar to the phasor notation for sinusoidal current and voltage, R and its associated angle of 0° are fixed, non-varying quantities. 3

4
Resistive ac circuit.

5
Resistive ac circuit Voltage is 100 volts Peak

6
Waveforms for Last Example Resistive

7
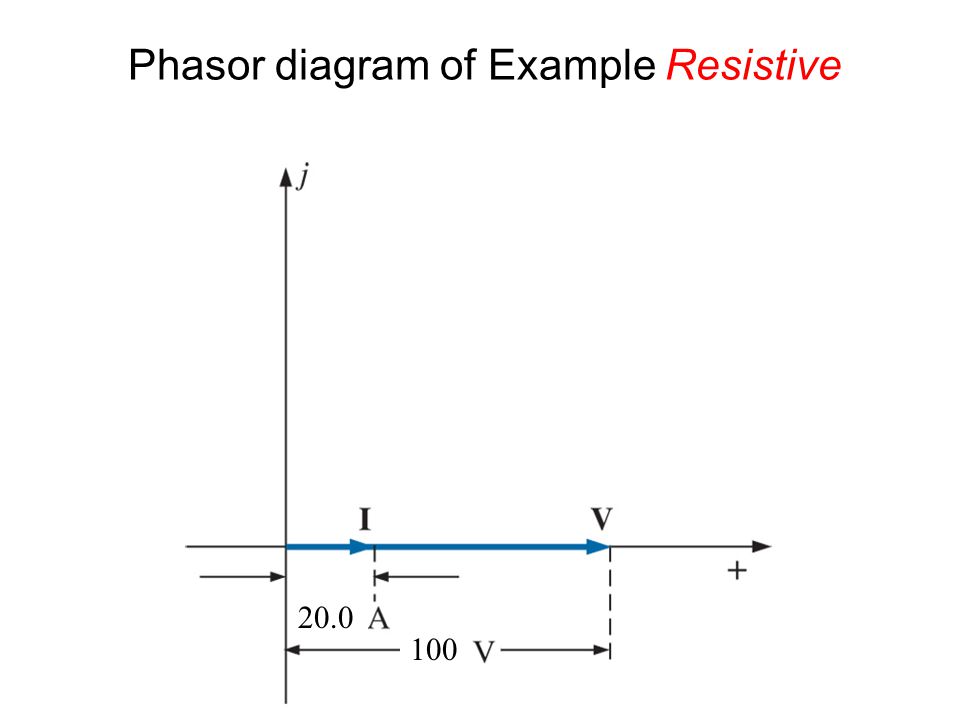
Phasor diagram of Example Resistive
20.0 100
8
Analysis of Resistive Circuits
The application of Ohm’s law to series circuits involves the use of the quantities Z, V, and I as: V = IZ I = V/Z Z = V/I R = Z

9
Impedance and the Phasor Diagram
Capacitive Reactance (XC) Use C = – 90° in the following polar format for capacitive reactance to ensure the proper phase relationship between the voltage and current of an capacitor: The boldface roman quantity Zc, having both magnitude and an associated angle, is referred to as the impedance of a capacitive element. 6
 Use C = – 90° in the following polar format for capacitive reactance to ensure the proper phase relationship between the voltage and current of an capacitor: The boldface roman quantity Zc, having both magnitude and an associated angle, is referred to as the impedance of a capacitive element. 6.")
10
Impedance and the Phasor Diagram
ZC is measured in ohms and is a measure of how much the capacitive element will “control or impede” the level of current through the network. This format like the one for the resistive element, will prove to be a useful “tool” in the analysis of ac networks. Be aware that ZC is not a phasor quantity for the same reason indicated for a resistive element. 7

11
Analysis of Capacitive ac Circuit
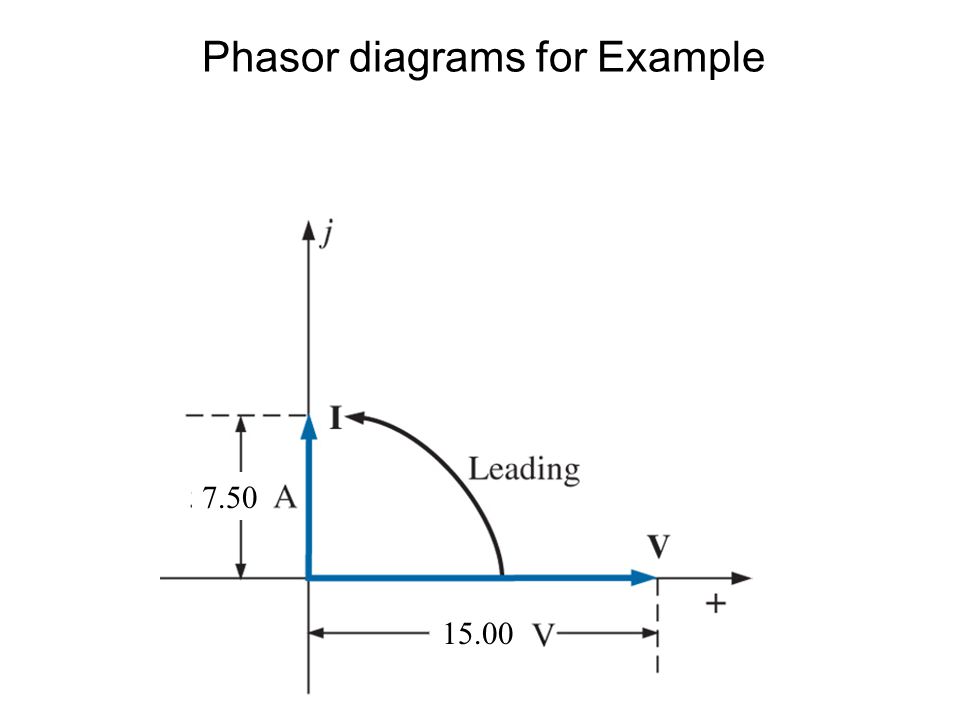
The current leads the voltage by 90 in a purely capacitive ac circuit

12
Capacitive ac circuit.

13
Capacitive ac circuit, Voltage is 15 volts peak

14
Waveforms for Example current leads the voltage by 90 degrees

15
Phasor diagrams for Example
7.50 15.00
16
Impedance and the Phasor Diagram
Inductive Reactance (XL) Use L = 90° in the following polar format for inductive reactance to ensure the proper phase relationship between the voltage and the current of an inductor: The boldface roman quantity ZL, having both magnitude and an associated angle, in referred to as the impedance of an inductive element. 4
 Use L = 90° in the following polar format for inductive reactance to ensure the proper phase relationship between the voltage and the current of an inductor: The boldface roman quantity ZL, having both magnitude and an associated angle, in referred to as the impedance of an inductive element. 4.")
17
Impedance and the Phasor Diagram
ZL is measured in ohms and is a measure of how much the inductive element will “control or impede” the level of current through the network. This format like the one for the resistive element, will prove to be a useful “tool” in the analysis of ac networks. Be aware that ZL is not a phasor quantity for the same reason indicated for a resistive element. 5

18
Inductive ac circuit.

19
Inductive ac circuit Voltage is 24 volts Peak

20
Inductor Waveforms for Example voltage leads the current by 90 degrees

21
Phasor diagrams for Example.
24.0 V 8.0

22
Three cases of impedance R – C series circuit

23
Illustration of sinusoidal response with general phase relationships of VR, VC, and I relative to the source voltage. VR and I are in the phase; VR leads VS; VC lags VS; and VR and VC are 90º out of phase.

24
Impedance of a series RC circuit.

25
Development of the impedance triangle for a series RC circuit.

26
Impedance of a series RC circuit.

27
Impedance of a series RC circuit.

28
Phase relation of the voltages and current in a series RC circuit.

29
Voltage and current phasor diagram for the waveforms

30
Voltage diagram for the voltage in a R-C circuit

31
Voltage diagram for the voltage in a R-C circuit

32
An illustration of how Z and XC change with frequency.

33
As the frequency increases, XC decreases, Z decreases, and decreases
As the frequency increases, XC decreases, Z decreases, and decreases. Each value of frequency can be visualized as forming a different impedance triangle.

34
Illustration of sinusoidal response with general phase relationships of VR, VL, and I relative to the source voltage. VR and I are in phase; VR lags VS; and VL leads VS. VR and VL are 90º out of phase with each other.

35
Impedance of a series RL circuit.

36
Development of the Impedance triangle for a series RL circuit.

37
Impedance of a series RL circuit.

38
Impedance of a series RL circuit.

39
Phase relation of current and voltages in a series RL circuit.

40
Voltage phasor diagram for the waveforms .

41
Voltage and current phasor diagram for the waveforms

42
Voltages of a series RL circuit.

43
Voltages of a series RL circuit.

44
Reviewing the frequency response of the basic elements.

45
Frequency Selectivity of RC Circuits
Frequency-selective circuits permit signals of certain frequencies to pass from the input to the output, while blocking all others A low-pass circuit is realized by taking the output across the capacitor, just as in a lag network A high-pass circuit is implemented by taking the output across the resistor, as in a lead network

46
The RC lag network (Vout = VC)
")
47
FIGURE 10-17 An illustration of how Z and XC change with frequency.

48
Frequency Selectivity of RC Circuits
The frequency at which the capacitive reactance equals the resistance in a low-pass or high-pass RC circuit is called the cutoff frequency: fc = 1/(2RC)
")
49
Normalized general response curve of a low-pass RC circuit showing the cutoff frequency and the bandwidth - 3 dB point normalized Cutoff point

50
Example of low-pass filtering action
Example of low-pass filtering action. As frequency increases, Vout decreases

51
The RC lead network (Vout = VR)
")
52
Example of high-pass filtering action
Example of high-pass filtering action. As frequency increases, Vout increases

53
High-pass filter responses.

54
High-pass filter responses, filters in series
Each r-c combination - 20dB / decade

55
Observing changes in Z and XL with frequency by watching the meters and recalling Ohm’s law

56
RL Circuit as a Low-Pass Filter
An inductor acts as a short to dc As the frequency is increased, so does the inductive reactance As inductive reactance increases, the output voltage across the resistor decreases A series RL circuit, where output is taken across the resistor, finds application as a low-pass filter

57
Example of low-pass filtering action
Example of low-pass filtering action. Winding resistance has been neglected. As the input frequency increases, the output voltage decreases

58
RL Circuit as a High-Pass Filter
For the case when output voltage is measured across the inductor At dc, the inductor acts a short, so the output voltage is zero As frequency increases, so does inductive reactance, resulting in more voltage being dropped across the inductor The result is a high-pass filter

59
FIGURE 12-39 Example of high-pass filtering action
FIGURE Example of high-pass filtering action. Winding resistance has been neglected. As the input frequency increases, the output voltage increases.

Similar presentations


 1.Find C T 2. Using V C = V S (1 - e -t/ ), what is the voltage across a capacitor at 10 seconds if R = 5Ω, C=2F,>")


