Download presentation
Presentation is loading. Please wait.

1
CoursEval Fall 2011 User Conference Simplified reporting with visual dashboards Who am I Brief explanation of what data to export from CoursEval Show data in several views after it is imported into Tableau Explain some of the attributes of Tableau What your customer sees-Tableau Reader

2
Sue VanDyne Senior Specialist for Institutional Research Ohio Northern University Fact Book Common Data Evaluations and Surveys Special Requests

3
Ohio Northern University, Ada, Ohio Enrollment – approximately 3500 Purchased CoursEval in 2006 Recently switched from quarters to semesters 5 colleges-all using electronic evaluations Arts and SciencesPharmacy BusinessLaw Engineering Several non-coursed based surveys

4
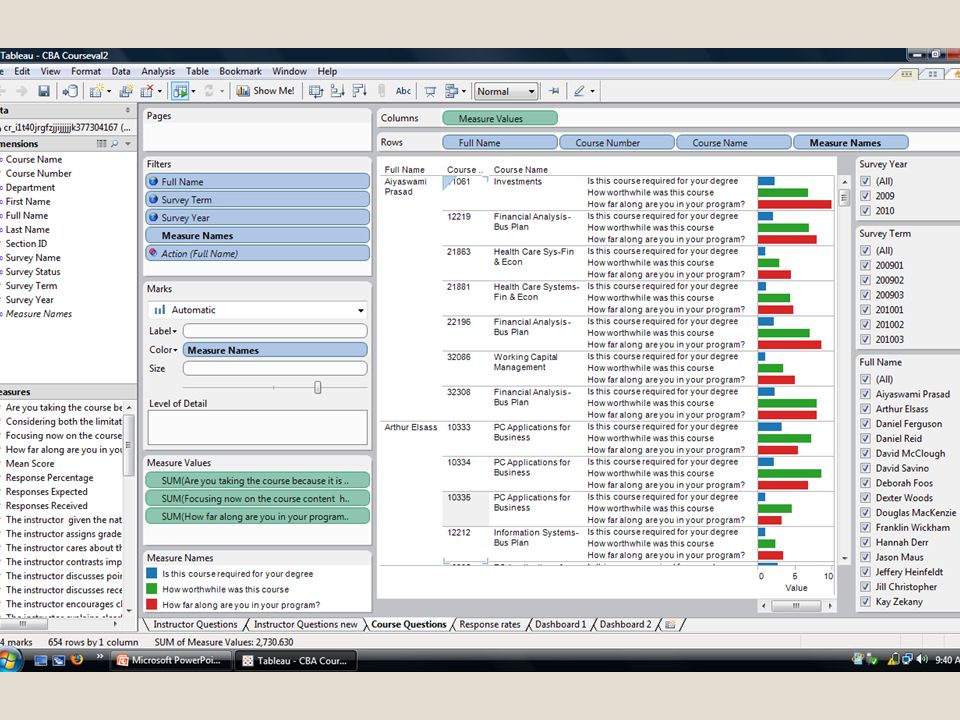
The request What information from CoursEval to use. What information looks like when brought into Tableau The end result or “Icing on the cake”

5
Dean/Chair has requested to have a report that encompasses several periods of evaluations for all faculty in their college. This is usually for a annual report. By period (quarter or semester) By individual By course
 By individual By course.")
6
Export data from CoursEval You can use csv, excel or access Save to a location that won’t be moved Remove summary line You will keep adding on to this file every semester/quarter

Similar presentations


 823-2251 All Graduate Issues Assistant Director, Graduate Academic.>")
