Download presentation
Presentation is loading. Please wait.

1
Transportation leadership you can trust. presented to SE Florida FSUTMS Users Group by FDOT D4 PL&EM Cambridge Systematics, Inc. May 8, 2009 Southeast Florida Roadway & Transit User Cost Calculators

2
2 Agenda Introduction Travel Time Values Vehicle Operating Costs Transit Operating Costs Calculator Application Examples Discussion

3
3 Purpose Better assessment of transportation improvement benefits Systemwide −LRTP Corridor alternative comparison −Benefit/Cost Analysis Operational improvements −Cost of lane closures −Value of early completion

4
The Calculator Provides unit costs for various segmentations Provides price escalation trends for future costs Output FL and SE FL values Allows for overwriting default inputs Up to users to decide how to use it 4

5
Components Travel Time Value (TTV) Auto; Truck Transit User TTV −Bus; Tri-Rail; Metrorail Vehicle Operating Cost (VOC) Auto; Truck Transit Operating Cost Bus; Commuter Rail; Light Rail; Demand Response 5
 Auto; Truck Transit User TTV −Bus; Tri-Rail; Metrorail Vehicle Operating Cost (VOC) Auto; Truck Transit Operating Cost Bus; Commuter Rail; Light Rail; Demand Response 5")
6
6 Highway Components RUC = TTV + VOC Road User Cost = Travel Time Value + Vehicle Operating Cost

7
7 Methodology TTV Market Segmentations Segmentation Type Segmentation Details Mode Auto, Transit: Access and In/Out-Vehicle Occupational Commercial Vehicle Drivers Purpose of Travel Personal/Visitor, Commute, Business (On-the-Clock) Time of Day Peak, Off-Peak
 Time of Day Peak, Off-Peak")
8
8 1: Travel Time Values Based on hourly wage Personaltrips50% Commute trips60% On-the-clock trips100% Base Figures in 2004$

9
9 Travel Time Value Validation Survey Telephone survey, stated preference 5,000 random households Miami-Dade to Indian River Dec ’04 - Jan ’05 1,070 successful responses Work trips: $10 - $13/hr Non-work: 40% of wage

10
Transit User Travel Time Value Trip purpose segmentation Personal travel/Visitor Commute On-the-clock Time-of-Day segmentation Peak; off-peak Based on transit on-board surveys 1999 SEFL Travel Characteristics Survey 2007 Tri-Rail On-Board Survey 2004 Metro-Rail On-Board Survey 2004 Metrobus On-Board Survey 10

11
11 Wage Projection Wage Data is available from 1951 to 2006. Regression Analysis indicates strong fit (R-square = 0.998). According to Social Security Online (www.ssa.org), national median wage is about 70% of national average wage.www.ssa.org Future year TTVs are calculated based on projected median wages.
. According to Social Security Online ( national median wage is about 70% of national average wage. Future year TTVs are calculated based on projected median wages..")
12
12 Travel Time Values (2004) Commuter, Personal, and On-the-clock Travel TTVs Florida Median SoutheastFlorida % of Wage Rate Hourly median wage (2000)$9.96/Hr$10.56/Hr Personal (local)$5.52/Hr$5.86/Hr50% Personal (visitor)$6.00/Hr 50% Commuter$6.63/Hr$7.03/Hr60% On-the-clock$11.39/Hr$12.08/Hr100% Annual median wages from 2000 census: SEFL = $21,975; FL = $20,721 Median income is about 70% of average income.
 Commuter, Personal, and On-the-clock Travel TTVs Florida Median SoutheastFlorida % of Wage Rate Hourly median wage (2000)$9.96/Hr$10.56/Hr Personal (local)$5.52/Hr$5.86/Hr50% Personal (visitor)$6.00/Hr 50% Commuter$6.63/Hr$7.03/Hr60% On-the-clock$11.39/Hr$12.08/Hr100% Annual median wages from 2000 census: SEFL = $21,975; FL = $20,721 Median income is about 70% of average income.")
13
13 Commercial Vehicle Travel Time Values (2004) On-the-Clock TTVs FloridaMedianSoutheastFlorida Hourly median wage (2000)$9.96/Hr$10.56/Hr Hourly median wage (2004) $11.39/Hr $12.08/Hr Annual median wages from 2000 census: SEFL = $21,975; FL = $20,721 Median income is about 70% of average income.
 On-the-Clock TTVs FloridaMedianSoutheastFlorida Hourly median wage (2000)$9.96/Hr$10.56/Hr Hourly median wage (2004) $11.39/Hr $12.08/Hr Annual median wages from 2000 census: SEFL = $21,975; FL = $20,721 Median income is about 70% of average income.")
14
14 Transit User Travel Time Values (2004) Commuter, Personal, and On-the-clock Travel TTVs Florida Median SoutheastFlorida % of Wage Rate Median Transit User Wage (2000) $9,094 $9,644 Hourly (2000)$4.37/Hr$4.64/Hr Commuter$3.57/Hr$3.78/Hr75% Personal (local)$2.38/Hr$2.52/Hr50% Personal (visitor)$2.58/Hr 50% On-the-clock$7.14/Hr$7.57/Hr100%
 Commuter, Personal, and On-the-clock Travel TTVs Florida Median SoutheastFlorida % of Wage Rate Median Transit User Wage (2000) $9,094 $9,644 Hourly (2000)$4.37/Hr$4.64/Hr Commuter$3.57/Hr$3.78/Hr75% Personal (local)$2.38/Hr$2.52/Hr50% Personal (visitor)$2.58/Hr 50% On-the-clock$7.14/Hr$7.57/Hr100%")
15
15 2: Vehicle Operating Costs (VOC) Adjustment Factors Cost Parameters
 Adjustment Factors Cost Parameters")
16
16 Vehicle Operating Cost Assumptions Vehicle class types – compact, mid-size, large, SUV, Minivan, and trucks Driving range – 12,000-15,000 miles per year Vehicle lifespan – 150,000 mi Southeast Florida Urban setting Flat surface

17
17 Factors Affecting Vehicle Operating Costs Cost Category City vs. Highway Pavement Roughness Geography Vehicle Age Fuel Consumption YesNoYesNo Maintenance and Repair Yes No TiresNoYesNo DepreciationYes NoYes

18
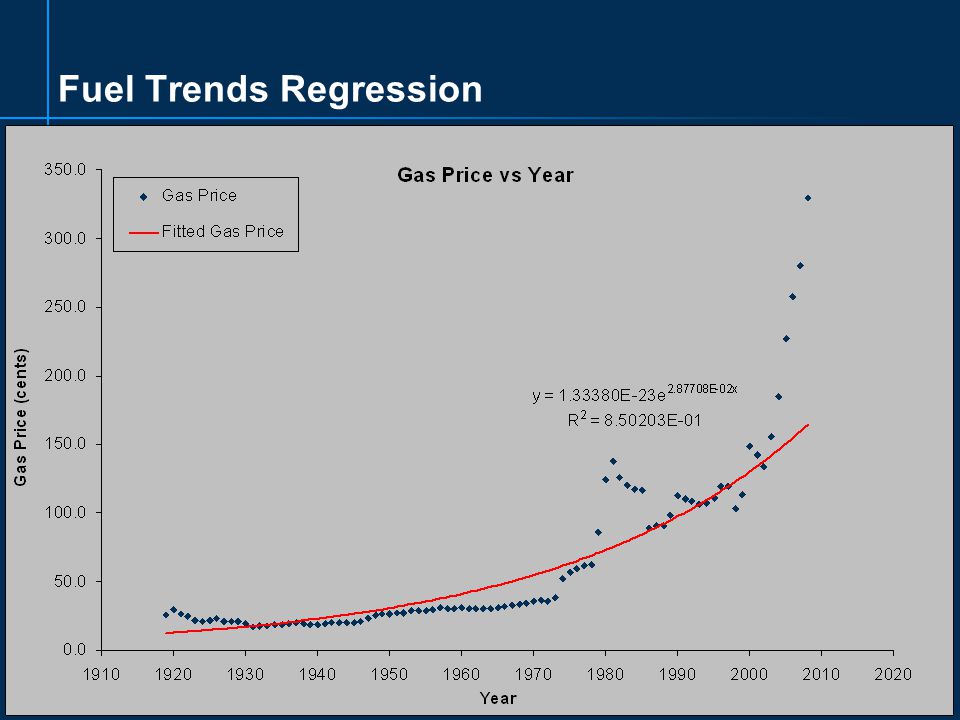
18 Default Assumptions Urban settings assumed in South Florida City conditions generate 35% more fuel consumption than highway conditions About 3% annual price increase applied to maintenance and repairs based on historical (20-year period) CPI trends
 CPI trends")
19
Fuel Trends Regression

22
CPI Regression

23
23 Vehicle Operating Costs – Depreciation CostRegionCompactMid-sizeLargeMinivanSUV Annual ($) South Florida $1,805$1,991$4,031$2,418$4,269 South Florida (cents/mile) 12-1513-1627-3316-2028-35 Annual ($) Florida $1,809$1,995$4,039$2,423$4,278 Florida (cents/mile) 12-1513-1627-3316-2028-35 2004 $
 South Florida $1,805$1,991$4,031$2,418$4,269 South Florida (cents/mile) Annual ($) Florida $1,809$1,995$4,039$2,423$4,278 Florida (cents/mile) $")
24
24 Vehicle Operating Costs – Insurance CostRegionCompactMid-sizeLargeMinivanSUV Annual Avg. South Florida $1,147$1,000$917$897$963 Cents/mile8-107-86-86-76-8 Annual Avg. Florida $1,100$955$877$853$925 Cents/mile7-96-86-7 6-8 U.S.1.4-8.6 2004 $

25
25 Vehicle Operating Costs – Fuel Cost Region (cents/mile) Compact MPG (24-34) Mid-size MPG (24-30) Large MPG (17-25) Minivan MPG (19-27) SUV MPG (16-21) Southeast Florida 4-75-76-106-97-10 Florida4-75-76-106-97-10 U.S.6.1-8.3 $/gallon = $1.53-$1.65 (2004)
 Compact MPG (24-34) Mid-size MPG (24-30) Large MPG (17-25) Minivan MPG (19-27) SUV MPG (16-21) Southeast Florida Florida U.S $/gallon = $1.53-$1.65 (2004)")
26
26 Vehicle Operating Costs – Financial Charges Region (cents/mile) CompactMid-sizeLargeMinivanSUV Southeast Florida 2-4 3-5 4-6 Florida2-4 3-5 4-6 U.S.4.4-7.4 Average interest rate = 4.45% (2004) Financial Charges = Interest on vehicle loan
 CompactMid-sizeLargeMinivanSUV Southeast Florida Florida U.S Average interest rate = 4.45% (2004) Financial Charges = Interest on vehicle loan")
27
27 Vehicle Operating Costs – Fuel Tax Region (cents/mile) CompactMid-sizeLargeMinivanSUV Southeast Florida 1-2 2-3 2-4 Florida1-2 2-3 U.S.1.8- 4.1 Federal = 18.4 cents/gallon State = 14.3 cents/gallon Local = 6-12 cents/gallon
 CompactMid-sizeLargeMinivanSUV Southeast Florida Florida U.S Federal = 18.4 cents/gallon State = 14.3 cents/gallon Local = 6-12 cents/gallon")
28
28 Vehicle Operating Cost Components Mid-size Auto Cost Items Annual VOC VOC in cents/mile SEFLFLSEFLFL Fuel Cost $1,160$1,1609.79.7 Fuel Tax $275$2592.32.2 Maintenance and Repairs $259$2592.22.2 Tires$119$1191.01.0 Insurance$1,078$1,0209.08.5 Total Depreciation $1,632$1,63213.613.6 Finance Charges $479$4814.04.0 License and Registration $51$510.40.4 Total Annual Costs $5,054$4,981 42.141.5 2004 $

29
29 Auto and Commercial VOC (2004)Florida Southeast Florida Per Mile Cost Annual Cost Per Mile Cost Annual Cost Small$0.395$4,741$0.389$4,666 Median$0.421$5,054$0.415$4,981 Large$0.540$6,481$0.534$6,412 Single-Unit Truck$0.488$48,789$0.484$48,435 Combination- Unit Truck$0.710$71,047$0.707$70,652 Fleet Average$0.552$12,657$0.518$9,327
Florida Southeast Florida Per Mile Cost Annual Cost Per Mile Cost Annual Cost Small$0.395$4,741$0.389$4,666 Median$0.421$5,054$0.415$4,981 Large$0.540$6,481$0.534$6,412 Single-Unit Truck$0.488$48,789$0.484$48,435 Combination- Unit Truck$0.710$71,047$0.707$70,652 Fleet Average$0.552$12,657$0.518$9,327")
30
Transit Operating Costs Service and cost data obtained from National Transit Database (NTD) - Federal Transit Administration Modes: Bus; Demand Response; Commuter Rail; Light Rail Data: Services: passenger trips; revenue hours; revenue miles Costs: operators’ wage; material and supplies; utilities; insurance; tax; purchased transportation; ADA related expense; other expenses. Unit cost = (total costs)/(total services provided)
/(total services provided).")
31
31 Transit Vehicle Operating Costs (2004) Southeast Florida Transit Vehicle Operating Costs Bus Demand Response (DO) Demand Response (PT) Commuter Rail Light Rail (Tampa) Total Expense (thousand) $437,916 $4,560 $110,817 $31,414 $1,608 Total Passenger Trips (thousand) 129,010.2 270.5 3,029.4 2,674.6 520.2 Total Revenue Miles (thousand) 57,519.7 1,338.0 30,147.6 2,685.1 174.3 Total Revenue Hours (thousand) 4,411.0 98.1 2,077.9 77.6 36.0 Cost / Passenger Trip $3.2 $16.86 $36.58 $11.7 $3.1 Cost / Revenue Mile $7.1 $3.4 $3.7 $11.7 $9.2 Cost / Revenue Hour $93.0 $46.5 $53.3 $404.8 $44.6
 Southeast Florida Transit Vehicle Operating Costs Bus Demand Response (DO) Demand Response (PT) Commuter Rail Light Rail (Tampa) Total Expense (thousand) $437,916 $4,560 $110,817 $31,414 $1,608 Total Passenger Trips (thousand) 129, , , Total Revenue Miles (thousand) 57, , , , Total Revenue Hours (thousand) 4, , Cost / Passenger Trip $3.2 $16.86 $36.58 $11.7 $3.1 Cost / Revenue Mile $7.1 $3.4 $3.7 $11.7 $9.2 Cost / Revenue Hour $93.0 $46.5 $53.3 $404.8 $44.6")
32
32 3. Calculators Auto and Commercial Vehicle User TTV Calculator Transit User TTV Calculator Auto and Commercial VOC Calculator Transit VOC Calculator

33
Purpose of Calculators Provide LOCAL data values Analysis for different years / horizons Ability to change defaults Fuel prices Fleet composition – increase in small vehicles? Others…

34
34 Calculator Main Panel

35
35 Auto and Commercial Vehicle User TTV Calculator Input Current year/target year Wages (optional) Inflation factors (optional) TTV segmentations (optional) Output - Auto and Commercial Vehicle User TTV by Geographic level Trip type Trip purpose Vehicle type Time of day
 Inflation factors (optional) TTV segmentations (optional) Output - Auto and Commercial Vehicle User TTV by Geographic level Trip type Trip purpose Vehicle type Time of day")
36
36 Input page … Auto and Commercial Vehicle User TTV Calculator

37
37 … Auto and Commercial Vehicle User TTV Calculator Output page

38
38 Transit User TTV Calculator Input Current Year/Target Year Wages (optional) Inflation factors (optional) TTV markets Output - transit user TTV by Geographic level Transit mode Trip type Trip purpose Waiting and transferring
 Inflation factors (optional) TTV markets Output - transit user TTV by Geographic level Transit mode Trip type Trip purpose Waiting and transferring")
39
39 Transit User TTV Calculator … Input page

40
40 Transit User TTV Calculator Output page

41
41 Auto and Commercial VOC Calculator Key Input Current fuel price Current year / target year Average travel speed Output - annual cost and per mile cost by Cost component Total costs

42
Auto and Commercial VOC Calculator Input Page … …

43
43 Auto and Commercial VOC Calculator Output Page

44
44 Transit VOC Calculator Input Service Data Mode Route Length Weekday Service Schedule Weekend Service Schedule Update Cost Item (Optional) Output – Transit Vehicle Operating Cost by: Mode Total Annual Service (Revenue Miles) Total Annual Operating Cost Annual Operation Cost per Revenue Mile
 Output – Transit Vehicle Operating Cost by: Mode Total Annual Service (Revenue Miles) Total Annual Operating Cost Annual Operation Cost per Revenue Mile")
45
45 Transit VOC Calculator … By Region By County By State By Nation

46
46 Transit VOC Calculator Input Page

47
Transit VOC Calculator Output Page

48
48 Reference Data Median/Average Wage CPI Crude Oil Price Gasoline Price Auto Price Vehicle Fleet Composition Transit User Income Bus Rider Income Tri-Rail Rider Income MetroRail Rider Income Vehicle Depreciation Vehicle Speed vs. Fuel Consumption

49
49 4. Sample Applications 1. Lane closure cost calculation Hypothesis scenario Additional cost for roadway users (TTV + VOC) resulted from lane closure 2. Trip cost comparison for Auto and Transit Cost for roadway user (TTV + VOC) and transit user (TTV + fare) Downtown Coral Springs to Fort Lauderdale
 resulted from lane closure 2. Trip cost comparison for Auto and Transit Cost for roadway user (TTV + VOC) and transit user (TTV + fare) Downtown Coral Springs to Fort Lauderdale.")
50
50 Sample Application 1 Left Lane Closure on I-595 from University Dr. to FTPK Conditions −2009, 2 days, 2.2 miles −AADT 227,000 −Average occupancy: 1.2 people per vehicle −Average travel speed reduced from 55mph to 35mph −TTV in 2009: $8.16 per hour −VOC at 35mph: $0.471/mile; VOC at 55mph: $0.461/mile Costs −TTV increased : (2.2/35 – 2.2/55)*8.16*227,000*1.2*2 = $101,613 −VOC increased: ($0.471 – $0.461)*2.2*227,000*2 = $9,988 −Total cost = TTV + VOC = $111,601
*8.16*227,000*1.2*2 = $101,613 −VOC increased: ($0.471 – $0.461)*2.2*227,000*2 = $9,988 −Total cost = TTV + VOC = $111,601.")
51
51 Sample Application 2 Downtown Coral Springs to Fort Lauderdale Discussion: what TTV should be used for the transit alternative? Value of Wait time? Time Vehicle Dist. Avg. Spd. (mph) Travel Time (mins ) TTV/ hour Trip TTV VOC/ mi Trip VOC Total Trip Cost Peak Hour Mid-size Car 20 miles 25 mph 48$7.82$6.26$0.52 $10.4 0 $16.6 6 Bus 10 mph 120$5.26 $10.5 2 - $2.50 fare $13.0 2 Off- Peak Hour Mid-size Car 40 mph 30$7.76$3.88$0.45$9.00 $12.8 8 Bus 16 mph 75$4.02$5.03- $2.50 fare $7.53
 Travel Time (mins ) TTV/ hour Trip TTV VOC/ mi Trip VOC Total Trip Cost Peak Hour Mid-size Car 20 miles 25 mph 48$7.82$6.26$0.52 $ $ Bus 10 mph 120$5.26 $ $2.50 fare $ Off- Peak Hour Mid-size Car 40 mph 30$7.76$3.88$0.45$9.00 $ Bus 16 mph 75$4.02$5.03- $2.50 fare $7.53.")
52
52 Discussion

Similar presentations