Download presentation
Presentation is loading. Please wait.

1
Slides prepared by Thomas Bishop 国 际 贸 易 International Trade Dr. Miaojie Yu CCER Peking University

2
Copyright © 2006 Pearson Addison-Wesley. All rights reserved. 联系信息 Contact Information Instructor 教师 : 余淼杰博士 Office 办公室 : 郎润园 621 Office Hours 答疑时间 : 周一 15:30-16:30 Email: mjyu@ccer.edu.cnmjyu@ccer.edu.cn Telephone: 6275-3109 Fax: 6275-1475 Course Web: http://mjyu.ccer.edu.cn/courses/trade08.html http://mjyu.ccer.edu.cn/courses/trade08.html

3
Outline of the Talk Integration of Trade Disintegration of Production China’s Current Trade Situation Sino-U.S. Trade Relationship Traditional Trade Theory Current Research Topics Q&A

4
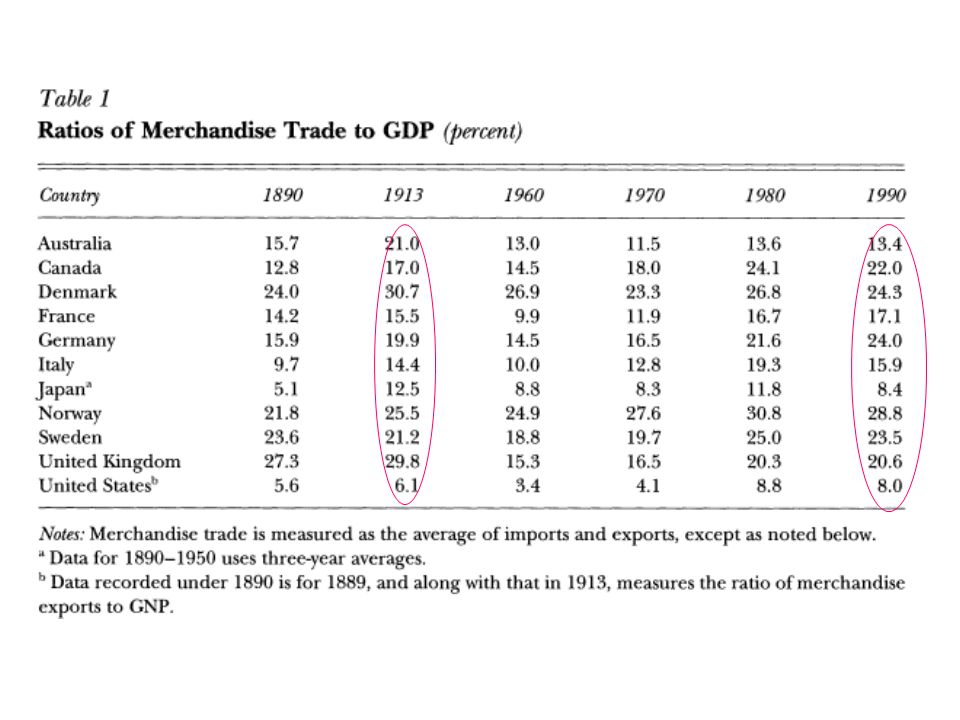
Integration of Trade How much do we trade? Trade still remains a seemingly small fraction of GDP for rich countries. The decades leading up to 1913 was a golden age of global trade and investment. The global integration of trade keeps the same level. Table 1 ( Feenstra, 1998)
.")
6
Integration of Trade

7
The World Is More Integrated Than Ever Some facts are hidden. Industrial countries have increasing shares of their economies devoted to services rather than manufacturing. Make comparison from different views. Should measure merchandise trade relative to merchandise value-added. Almost all countries have experienced substantial growth in trade. Table 2

9
Table 1.2 Merchandise Trade Relative to GDP and Merchandise Value-Added, 1960-1990 (percent)
")
10
4-10 Copyright © 2007 Pearson Addison-Wesley. All rights reserved. Table 1.1 U.S. Merchandise Trade by Industry, 2001, Shares of Total Trade and Production or Use (percentages)
.")
11
4-11 Copyright © 2007 Pearson Addison-Wesley. All rights reserved. Table 1.3 Percentage Distribution of Exports by Major Trading Groups, 1985-1998

12
How to Explain Growing Trade? Trade Liberalization –GATT/WTO –Regional Trade Agreements: CUSFTA, NAFTA, CARICOM, CACM, MERCOSUR, ASEAN, SPARTECA. Falling Transportation Cost 2/5 trade growth can be explained by these two factors. When trading partners becomes more similar in size. -- Example: World GDP=150; –Scenario 1: Country A= 100; country B=25, country C=25 –Scenario 2: Country A= 50; country B=50, country C=50 –Maximum exports are different.

13
Disintegration of Production Disintegration of production itself leads to more trade due, in large part, to the calculation method. Outsourcing Barbie doll story (Tempest, 1996) –Sell for about $10 in the U.S. –Made in Mainland China, but export from Hong Kong for $2 –65 cents cover materials cost, 35 cents pay for Chinese labor. –The remaining 1$ for transportation in China –The remaining 7$ for transportation, marketing, wholesaling and retailing. –$1 for the Mattel.
 –Sell for about $10 in the U.S. –Made in Mainland China, but export from Hong Kong for $2 –65 cents cover materials cost, 35 cents pay for Chinese labor. –The remaining 1$ for transportation in China –The remaining 7$ for transportation, marketing, wholesaling and retailing. –$1 for the Mattel..")
14
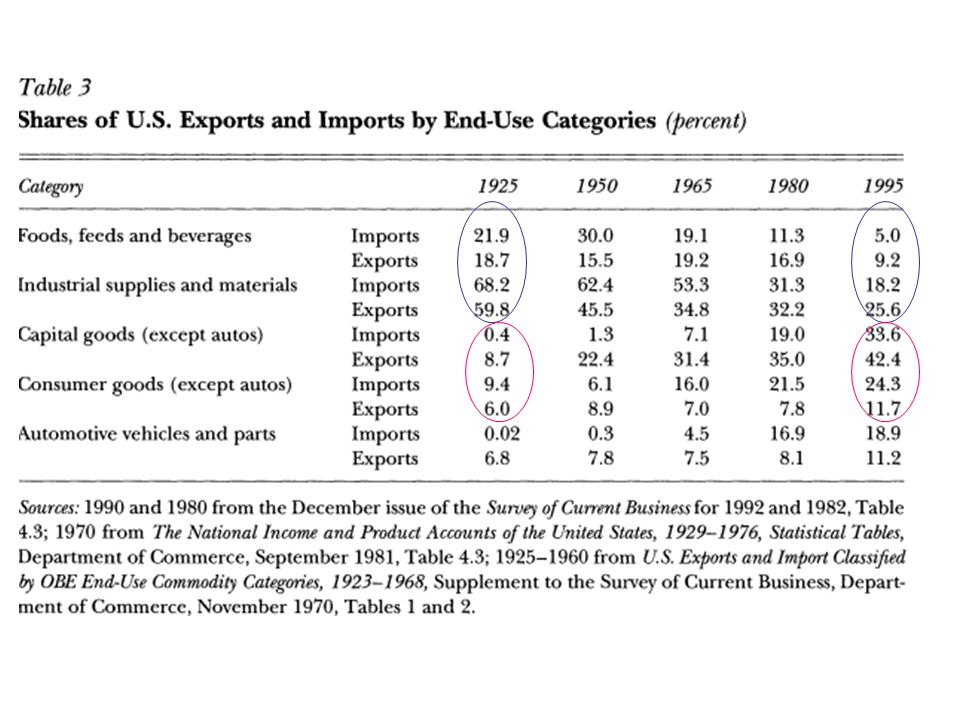
Outsourcing First measurement: trade is categorized by the end-user. The U.S. trade shifts away from agriculture and raw materials, and towards manufactured goods in the U.S. trade. Processed manufactured goods play an increasing important role in U.S. trade. Outsourcing is important! U.S. firms have been substituting away from these processing activities at home.

16
Outsourcing on the value-chain

17
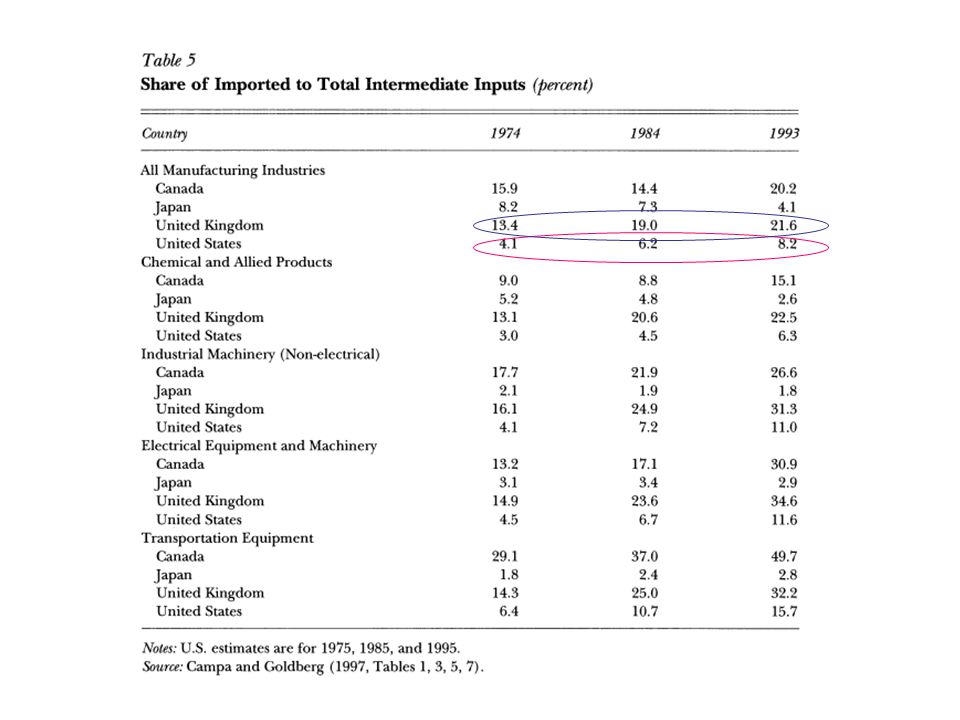
Another measurement: imported intermediate goods

18
The World is Flat Vertical specification : another name of Outsourcing U.S. has a doubling of the share of imported inputs between 1975 and 1995 for all manufacturing. The U.K. shows an especially large absolute increase in foreign outsourcing.

20
China’s Current Trade Performance Trade Growth Trade Liberalization Accede to the WTO Trade Pattern Increase of the inward FDI CCER, Dr. Miaojie Yu

21
GATT/WTO Members CCER, Dr. Miaojie Yu

22
Trade Openness China became the 143 rd member of the GATT/WTO China keeps a large trade surplus. Trade openness is $2,170 billion, which is more than 63% of current GDP in 2007 The third largest one in the world Current Export is $969 billion and import is $ 792 billion. So trade surplus is $177 billion in 2006. CCER, Dr. Miaojie Yu

23
Dramatic Increase in Openness CCER, Dr. Miaojie Yu

24
Trade Openness

25
China’s Current Trade Situation Current trade openness is around 64% of GDP. China’s share in world trade has grown steadily since 1979.

26
China’s Trade China has increased its penetration into rich countries’ market.

27
China’s Trade

29
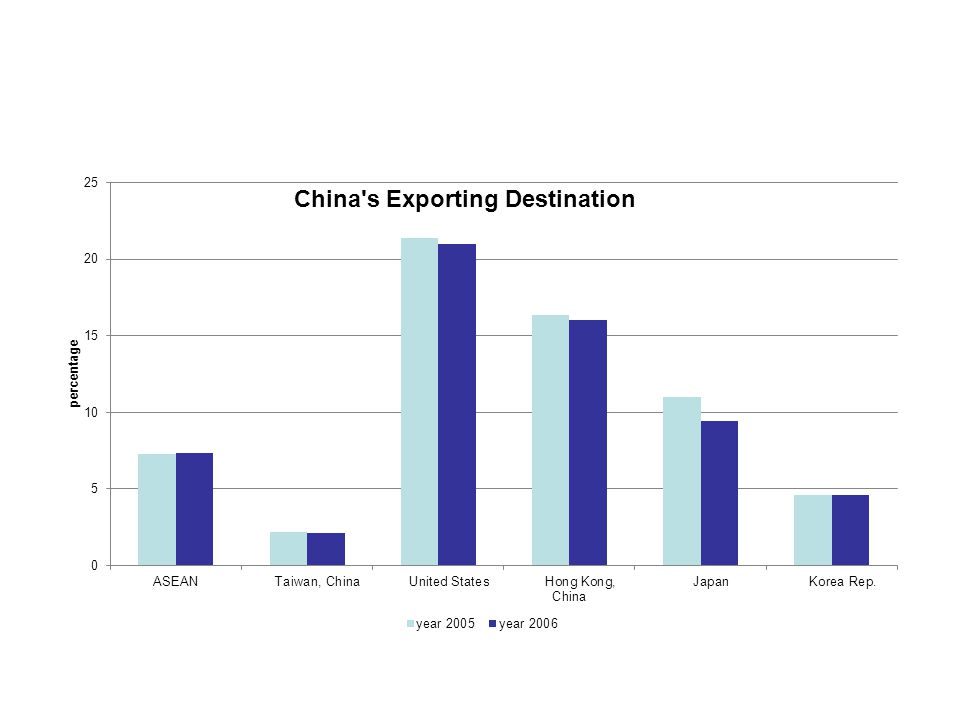
Simultaneously, it also becomes a more important export destination.

30
China’s Trade

31
China’s role in Asian Regional Trade China is now among the most important export destinations for other Asian economies

32
Strong Export Potential Forward in China China’s integration with the world economy so far is not unprecedented in either its scope or speed. Compared to Japan, Korea, and other NIEs in their fast development period, China’s exports have grown at a slower rate than theirs. This suggests that China could maintain relatively high strong export growth for years to come.

34
Composition of Trade Diversify from an initial heavy reliance on textile and other light manufacturing. In the early 1990s, exports profiles rank as follows: light manufacturing, textile, machinery and transport (small electronics). Today, China exports more sophisticated electronics, furniture, travel goods, and industrial supplies.
. Today, China exports more sophisticated electronics, furniture, travel goods, and industrial supplies..")
35
Intra-Industry Trade Sources: database of China Customs CCER, Dr. Miaojie Yu

36
Outsourcing in China

37
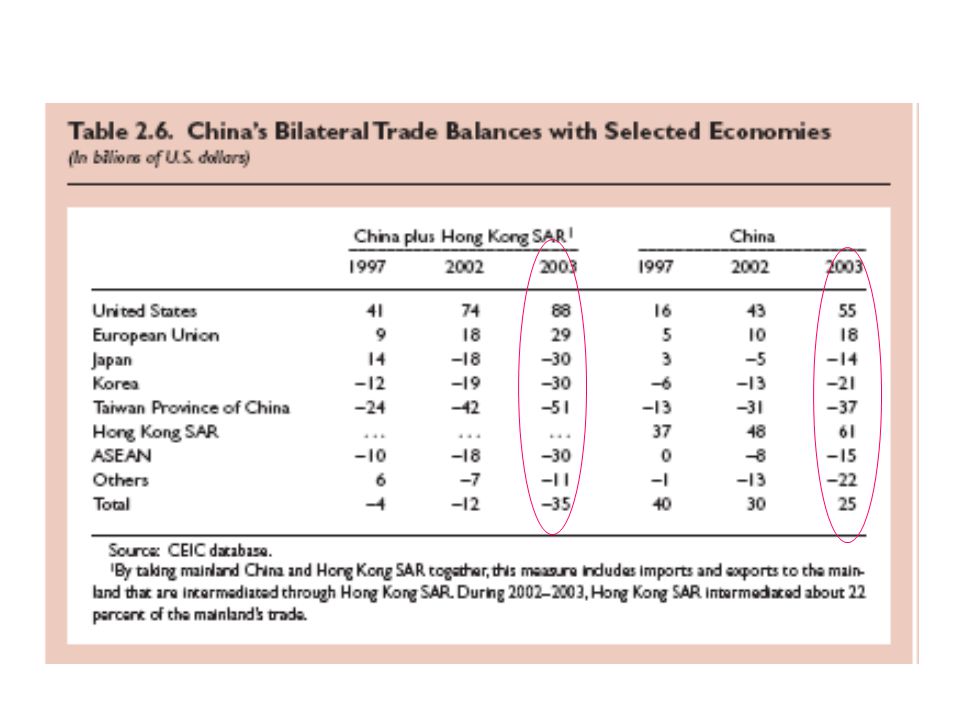
Trade Balance China keeps a modest overall trade surplus. China has significant trade surplus from trade with the U.S. But it was offset by an increasing trade deficit with the rest of Asia.

39
Sino-U.S. Bilateral Trade This year China reaches a $144 billion trade surplus with the U.S. Simultaneously, more than 3 million workers lost their jobs. Congressmen in the U.S. threat to perform trade sanction with China.—Impose 27.4% high tariffs. Push RMB revaluate strongly and quickly. Pending the permanent most favored nation (MFN) treatment.
 treatment..")
40
Questions Economically speaking, is it deficit necessary bad for the deficit country, and good for the surplus country? Any essential link between the blue-worker unemployment and trade deficit? Is it credible for the U.S. congressional threat?

41
Trade Deficit is not necessarily bad! Check the basic trade identity: Trade Deficit=Net Inflow of Foreign Capital Trade deficit is like borrowing money from foreigners. The key point is how to use. Investment or Consumption? Historical stories in 1980s, 1990s, and 2000s.

42
Trade Deficit itself is not Bad Trade deficit means financing from other countries. How to use such money? Consume it? Invest it? CCER, Dr. Miaojie Yu

43
Trade Surplus is not necessarily good! Statistically, it is good for GDP calculation. But GDP does not mean anything! Export Booming and Productivity Improvement –The termination of Multilateral Fiber Agreement (MFA) in 2005. Green GDP
 in Green GDP.")
44
The Far Cry from U.S. Workers Any essential link between the blue-worker unemployment and trade deficit? No. The elasticity of substitution between Chinese export and other Asian countries’ export is very high. The essential reason for huge unemployment is due to the economy recession in years 2001-2003 in the U.S.

45
The Congressional Threat It is incredible. The U.S. does not have any right to terminate our permanent MFN treatment. They don’t dare to uni-laterally impose high tariffs on Chinese textile and garments. –It violates the WTO principles. –It worse the U.S. itself due to the elasticity of exports and imports. –It already gets historical lesson from the stupid policy.

46
RMB Appreciation Helps? CCER, Dr. Miaojie Yu

47
RMB Appreciation Helps? China appreciates its RMB around 20% within 3 years CCER, Dr. Miaojie Yu

48
RMB Appreciation Helps? Change in exchange rate might help reduce the bilateral trade deficit, but cannot reduce the U.S. whole deficit. – Trading pattern in China and the ASEAN-10 are quite similar. –U.S. has to import similar products at a higher cost. The revaluation may not translate into significant higher prices for Chinese products sold in the U.S. –China firms may cut their profit margins to maintain their price instead. –Even if prices go up, U.S. consumers may be slow to switch to competing producers from other countries, which causes more trade deficit in the short run. CCER, Dr. Miaojie Yu

49
What do we study in Trade? Gains from Trade –Each trading country gains –Within a country, some gain but some lose Pattern of Trade –Who trade with whom for what? –Inter-sectional v.s. intra-sectional trade Government Effect of Policy on Trade Multinational Cooperation and Foreign Direct Investment (FDI)
.")
50
Traditional Trade Theory Smith’s Absolute Advantage Ricardian Comparative Advantage Heckscher-Ohlin Theory Viner’s Specific Factors Model Krugman’s Increasing Returns to Scale Model Feenstra’s Product Variety Model Melitz’s Intra-industry Trade

51
Top 10 Research Topics (Theoretical & Empirical) Heckscher-Ohlin Model (Leontief Paradox) Trade in Intermediate Goods, Wages, and Outsourcing Increasing Returns and the Gravity Equation Gains from Trade and Regional Trade Agreement Import Tariffs and NTBs ( Dumping, Quotas, and Subsidies) International Political Economy of Trade Policy Trade and Endogenous Growth Multinationals and Organization of the Firm Trade and Environment Trade and Geography
 Heckscher-Ohlin Model (Leontief Paradox) Trade in Intermediate Goods, Wages, and Outsourcing Increasing Returns and the Gravity Equation Gains from Trade and Regional Trade Agreement Import Tariffs and NTBs ( Dumping, Quotas, and Subsidies) International Political Economy of Trade Policy Trade and Endogenous Growth Multinationals and Organization of the Firm Trade and Environment Trade and Geography")
52
Top World-class Trade Economists Theory –Bhagwati –Grossman –Helpman –Krugman –Staiger –Melitz Empirics –Baldwin –Feenstra –Leamer –Trefler –Blonigen

Similar presentations