Download presentation
Presentation is loading. Please wait.

1
Software Engineering: Construction Romi Satria Wahono romi@romisatriawahono.net http://romisatriawahono.net +6281586220090

2
SD Sompok Semarang (1987) SMPN 8 Semarang (1990) SMA Taruna Nusantara, Magelang (1993) B.Eng, M.Eng and Ph.D in Software Engineering from Saitama University Japan (1994-2004) Universiti Teknikal Malaysia Melaka (2014) Research Interests: Software Engineering, Intelligent Systems Founder dan Koordinator IlmuKomputer.Com Peneliti LIPI (2004-2007) Founder dan CEO PT Brainmatics Cipta Informatika Romi Satria Wahono
 SMPN 8 Semarang (1990) SMA Taruna Nusantara, Magelang (1993) B.Eng, M.Eng and Ph.D in Software Engineering from Saitama University Japan ( ) Universiti Teknikal Malaysia Melaka (2014) Research Interests: Software Engineering, Intelligent Systems Founder dan Koordinator IlmuKomputer.Com Peneliti LIPI ( ) Founder dan CEO PT Brainmatics Cipta Informatika Romi Satria Wahono")
3
Course Contents -1- 1.Introduction to Software Engineering 1.What is Software 2.What is Software Engineering 3.Discipline and Curriculum of Software Engineering 2.Software Engineering Profession 1.Profession, Ethics and Certification 2.Software Industry and Market 3.Internet Business Model and Trends

4
Course Contents -2- 3.Software Engineering Process 1.Software Development Life Cycle (SDLC) 2.Software Development Methodologies 3.Software Development Notation (UML) and Tools 4.Object-Oriented Paradigm 4.Software Construction 1.Software Construction Process: Case Study 2.Estimating the Size of Software Project
 2.Software Development Methodologies 3.Software Development Notation (UML) and Tools 4.Object-Oriented Paradigm 4.Software Construction 1.Software Construction Process: Case Study 2.Estimating the Size of Software Project")
5
Course Contents -3- 5.Software Quality Assurance 1.The Uniqueness of Software Quality Assurance 2.What is Software Quality 3.Software Quality Factor 4.Software Testing 6.Software Engineering Research 1.Computing Research Methodology 2.Research Trends in Software Engineering 3.Case Study: Developing Research Proposal in Software Engineering Field

6
Software Construction

7
Contents 1.Software Construction Process 2.Case Study: Developing Software using UML and Java 3.Identifying the Project Size

8
1. Software Construction Process: Case Study

9
SDLC and Deliverables

10
Planning

11
When Do Projects Begin? When someone sees an opportunity to create business value from using information technology Then he or she creates a system request

12
Elements of a System Request 1.Project Name The name of project 2.Project sponsor Primary point of contact for the project 3.Business need Reason prompting the project 4.Business requirements Business capabilities the system will need to have 5.Business value Benefits the organization can expect from the project 6.Special issues Anything else that should be considered

13
Business Need Describes why the system should be built Why the project should be funded Should be clear and concise Probably not completely defined

14
Business Requirements What the system will do High level explanation to the approval committee Tell about the features and capabilities

15
Business Value Tangible value A quantifiable value E.g.: 2 % reduction in operating cost Intangible value Intuitive believe why the system will help the company E.g.: improved customer service, a better competitive position

16
Exercise: Identify Tangible and Intangible Value Dominion Virginia Power is one of the nation’s ten largest investor-owned electric utilities. The company delivers power to more than two million homes and businesses in Virginia and North Carolina. In 1997, the company overhauled some of its core processes and technology. The goal was to improve customer service and cut operations costs by developing a new workflow and geographic information system. When the project was finished, service engineers who used to sift through thousands of paper maps could pinpoint the locations of electricity poles with computerized searches. The project helped the utility improve management of all its facilities, records, maps, scheduling, and human resources. That, in turn, helped increase employee productivity, improve customer response times, and reduce the costs of operating crews.

17
Special Issues Identify special issues or constraints Budget constraints Deadline Legal requirements

18
Elements of a System Request

19
Exercise: Membuat System Request 1.Lihat contoh System Request untuk Internet Order Project 2.Pikirkan suatu sistem* yang saat ini dibutuhkan oleh perusahaan atau organisasi anda 3.Buat System Request dari sistem tersebut * System request yang anda buat akan menjadi studi kasus dari pembelajaran kita selama course berlangsung

20
System Request—Internet order project Project sponsor:Margaret Mooney, Vice President of Marketing Business Need:This project has been initiated to reach new Internet customers and to better serve existing customers using Internet sales support. Business Requirements: Using the Web, customers should be able to search for products and identify the brick-and-mortar stores that have them in stock. They should be able to put items on hold at a store location or place an order for items that are not carried or not in stock. The functionality that the system should have is listed below: 1.Search through the CD Selections’ inventory of products 2.Identify the retail stores that have the product in stock 3.Put a product on hold at a retail store and schedule a time to pick up the product 4.Place an order for products not currently in stock or not carried by CD Selections 5.Receive confirmation that an order can be placed and when it will be in stock Business Value: We expect that CD Selections will increase sales by reducing lost sales due to out-of-stock or nonstocked items and by reaching out to new customers through its Internet presence. We expect the improved services will reduce customer complaints, primarily because 50 percent of all customer complaints stem from out of stocks or nonstocked items. Also, CD Selections should benefit from improved customer satisfaction and increased brand recognition due to its Internet presence. Conservative estimates of tangible value to the company includes: 1.$750,000 in sales from new customers 2.$1,875,000 in sales from existing customers 3.$50,000 yearly reduction in customer service calls Special Issues or Constraints: The Marketing Department views this as a strategic system. This Internet system will add value to our current business model, and it also will serve as a proof of concept for future Internet endeavors. For example, in the future, CD Selections may want to sell products directly over the Internet. The system should be in place for the holiday shopping season next year.

21
Feasibility Analysis

22
Detailing Expected Costs and Benefits 1.Technical feasibility Can we build it? 2.Economic feasibility Should we build it? 3.Organizational feasibility If we build it, will they come?

23
Feasibility Analysis Template

24
Technical Feasibility:Can We Build It? Familiarity with application Knowledge of business domain Need to understand improvements Need to recognize pitfalls and bad ideas Familiarity with technology Is technology new to this organization? Is this a brand new technology? Extension of existing firm technologies

25
Technical Feasibility:Can We Build It? Project size Number of people, time, and features Compatibility with existing systems Systems are not built in a vacuum Needs to integrate with current systems and data

26
Economic Feasibility: Should We Build It?

27
Cost-Benefit Analysis - Cash Flow Project costs and benefits over several years (3–5) Use normal growth rates for sales etc. Total added to determine Overall Benefits = Total Benefits – Total Costs Higher number is better

28
Cost-Benefit Analysis - Cash Flow

29
Cash Flow Plan

30
Present Value (PV) The amount of an investment today compared to the same amount n years in the future Taking into account inflation and time PV = Amount (1 + Interest Rate) n
 The amount of an investment today compared to the same amount n years in the future Taking into account inflation and time PV = Amount (1 + Interest Rate) n")
31
Net Present Value

32
Net Present Value (NPV) The present value of benefit less the present value of cost NPV = PV Benefits – PV Costs
 The present value of benefit less the present value of cost NPV = PV Benefits – PV Costs")
33
NPV Calculation

34
Return on Investment (ROI) The Amount of revenue or cost savings results from a given investment ROI = Total Benefits – Total Costs Total Costs
 The Amount of revenue or cost savings results from a given investment ROI = Total Benefits – Total Costs Total Costs")
35
ROI Calculation

36
Break Even Point (BEP) The point in time when the costs of the project equal the value it has delivered BEP = * Use the yearly NPV amount from the first year in which project has positive cas h flow Yearly NPV * – Cumulative NPV Yearly * NPV
 The point in time when the costs of the project equal the value it has delivered BEP = * Use the yearly NPV amount from the first year in which project has positive cas h flow Yearly NPV * – Cumulative NPV Yearly * NPV")
37
Break Even Point (BEP)
")
38
Organizational Feasibility If we build it, will they come? Strategic Alignment How well does the project match up with the business strategy? Stakeholder analysis considers Project champion(s) Organizational management System users Anybody affected by the change
 Organizational management System users Anybody affected by the change.")
39
Stakeholder Analysis Considers Project champion(s) High-level non-IS executive Shepherds project to completion It's good to have more than one Organizational management Need this support to sell system to organization System users In the loop so end system meets needs
 High-level non-IS executive Shepherds project to completion It s good to have more than one Organizational management Need this support to sell system to organization System users In the loop so end system meets needs")
40
Stakeholder Analysis Considers

41
Feasibility Analysis Template Technical Feasibility: Can We Build It? 1.Familiarity with Application: Less familiarity generates more risk 2.Familiarity with Technology: Less familiarity generates more risk 3.Project Size: Large projects have more risk 4.Compatibility: The harder it is to integrate the system with the company’s existing technology, the higher the risk Economic Feasibility: Should We Build It? 1.Development costs 2.Annual operating costs 3.Annual benefits (cost savings and revenues) 4.Intangible costs and benefits Organizational Feasibility: If We Build It, Will They Come? 1.Project champion(s) 2.Senior management 3.Users 4.Other stakeholders 5.Is the project strategically aligned with the business?
 4.Intangible costs and benefits Organizational Feasibility: If We Build It, Will They Come. 1.Project champion(s) 2.Senior management 3.Users 4.Other stakeholders 5.Is the project strategically aligned with the business .")
42
Exercise: Membuat Feasibility Analysis 1.Lihat contoh Feasibility Analysis untuk Internet Order Project 2.Perhatikan kembali System Request yang sebelumnya sudah kita buat 3.Buat Feasibility Analysis dari system yang akan kita buat tersebut

43
Internet Order Feasibility Analysis Executive Summary Margaret Mooney and Alec Adams created the following feasibility analysis for the CD Selections Internet Order System Project. The System Proposal is attached, along with the detailed feasibility study. The highlights of the feasibility analysis are: Technical Feasibility The Internet Order System is feasible technically, although there is some risk. CD Selections’ risk regarding familiarity with Internet order applications is high The Marketing Department has little experience with Internet-based marketing and sales. The IT Department has strong knowledge of the company’s existing order systems; however, it has not worked with Web-enabled order systems. Hundreds of retailers that have Internet Order applications exist in the marketplace. CD Selections’ risk regarding familiarity with the technology is medium The IT Department has relied on external consultants and an Information Service Provider to develop its existing Web environment. The IT Department has gradually learned about Web systems by maintaining the current Web site. Development tools and products for commercial Web application development are available in the marketplace, although the IT department has little experience with them. Consultants are readily available to provide help in this area. The project size is considered medium risk The project team likely will include less than ten people. Business user involvement will be required. The project timeframe cannot exceed a year because of the Christmas holiday season implementation deadline, and it should be much shorter. The compatibility with CD Selections’ existing technical infrastructure should be good The current Order System is a client-server system built using open standards. An interface with the Web should be possible. Retail stores already place and maintain orders electronically. An Internet infrastructure already is in place at retail stores and at the corporate headquarters. The ISP should be able to scale their services to include a new Order System.

44
Economic Feasibility A cost–benefit analysis was performed; see attached spreadsheet for details. A conservative approach shows that the Internet Order System has a good chance of adding to the bottom line of the company significantly. ROI over 3 years: 229 percent Total benefit after three years: $3.5 million (adjusted for present value) Break-even occurs: after 1.7 years Intangible Costs and Benefits Improved customer satisfaction Greater brand recognition Organizational Feasibility From an organizational perspective, this project has low risk. The objective of the system, which is to increase sales, is aligned well with the senior management’s goal of increasing sales for the company. The move to the Internet also aligns with Marketing’s goal to become more savvy in Internet marketing and sales. The project has a project champion, Margaret Mooney, Vice President of Marketing. Margaret is well positioned to sponsor this project and to educate the rest of the senior management team when necessary. To date, much of senior management is aware of and supports the initiative. The users of the system, Internet consumers, are expected to appreciate the benefits of CD Selections’ Web presence. And, management in the retail stores should be willing to accept the system, given the possibility of increased sales at the store level. Additional Comments: The Marketing Department views this as a strategic system. This Internet system will add value to our current business model, and it also will serve as a proof of concept for future Internet endeavors. We should consider hiring a consultant with expertise in similar applications to assist with the project. We will need to hire new staff to operate the new system, from both the technical and business operations aspects.
 Break-even occurs: after 1.7 years Intangible Costs and Benefits Improved customer satisfaction Greater brand recognition Organizational Feasibility From an organizational perspective, this project has low risk. The objective of the system, which is to increase sales, is aligned well with the senior management’s goal of increasing sales for the company. The move to the Internet also aligns with Marketing’s goal to become more savvy in Internet marketing and sales. The project has a project champion, Margaret Mooney, Vice President of Marketing. Margaret is well positioned to sponsor this project and to educate the rest of the senior management team when necessary. To date, much of senior management is aware of and supports the initiative. The users of the system, Internet consumers, are expected to appreciate the benefits of CD Selections’ Web presence. And, management in the retail stores should be willing to accept the system, given the possibility of increased sales at the store level. Additional Comments: The Marketing Department views this as a strategic system. This Internet system will add value to our current business model, and it also will serve as a proof of concept for future Internet endeavors. We should consider hiring a consultant with expertise in similar applications to assist with the project. We will need to hire new staff to operate the new system, from both the technical and business operations aspects..")
45
200320042005Total Increased sales from new customers0750,000772,500 Increased sales from existing customers01,875,0001,931,250 Reduction in customer complaint calls050,000 Total Benefits:02,675,0002,753,750 PV of Benefits:02,521,4442,520,0715,041,515 PV of All Benefits:02,521,4445,041,515 Labor: Analysis, Design and Implementation162,00000 Consultant Fees50,00000 Office Space and Equipment7,00000 Software and Hardware35,00000 Total Development Costs:254,00000 Labor: Webmaster85,00087,55090,177 Labor: Network Technician60,00061,80063,654 Labor: Computer Operations50,00051,50053,045 Labor: Business Manager60,00061,80063,654 Labor: Assistant Manager45,00046,35047,741 Labor: 3 Staff90,00092,70095,481 Software upgrades and licenses4,0001,000 Hardware upgrades5,0003,000 User training2,0001,000 Communications charges20,000 Marketing expenses25,000 Total Operational Costs:446,000452,700464,751 Total Costs:700,000452,700464,751 PV of Costs:679,612426,713425,3131,531,638 PV of all Costs:679,6121,106,3251,531,638 Total Project Costs Less Benefits:(700,000)2,222,3002,288,999 Yearly NPV:(679,612)2,094,7312,094,7583,509,878 Cumulative NPV:(679,612)1,415,1193,509,878 Return on Investment:229.16%(3,509,878/1,531,638) Break-even Point:1.32 years(break-even occurs in year 2; [2,094,731 – 1,415,119] / 2,094,731 = 0.32) Intangible Benefits:Greater brand recognition Improved customer satisfaction
![Total Increased sales from new customers0750,000772,500 Increased sales from existing customers01,875,0001,931,250 Reduction in customer complaint calls050,000 Total Benefits:02,675,0002,753,750 PV of Benefits:02,521,4442,520,0715,041,515 PV of All Benefits:02,521,4445,041,515 Labor: Analysis, Design and Implementation162,00000 Consultant Fees50,00000 Office Space and Equipment7,00000 Software and Hardware35,00000 Total Development Costs:254,00000 Labor: Webmaster85,00087,55090,177 Labor: Network Technician60,00061,80063,654 Labor: Computer Operations50,00051,50053,045 Labor: Business Manager60,00061,80063,654 Labor: Assistant Manager45,00046,35047,741 Labor: 3 Staff90,00092,70095,481 Software upgrades and licenses4,0001,000 Hardware upgrades5,0003,000 User training2,0001,000 Communications charges20,000 Marketing expenses25,000 Total Operational Costs:446,000452,700464,751 Total Costs:700,000452,700464,751 PV of Costs:679,612426,713425,3131,531,638 PV of all Costs:679,6121,106,3251,531,638 Total Project Costs Less Benefits:(700,000)2,222,3002,288,999 Yearly NPV:(679,612)2,094,7312,094,7583,509,878 Cumulative NPV:(679,612)1,415,1193,509,878 Return on Investment:229.16%(3,509,878/1,531,638) Break-even Point:1.32 years(break-even occurs in year 2; [2,094,731 – 1,415,119] / 2,094,731 = 0.32) Intangible Benefits:Greater brand recognition Improved customer satisfaction](http://images.slideplayer.com/10/2894081/slides/slide_45.jpg "Total Increased sales from new customers0750,000772,500 Increased sales from existing customers01,875,0001,931,250 Reduction in customer complaint calls050,000 Total Benefits:02,675,0002,753,750 PV of Benefits:02,521,4442,520,0715,041,515 PV of All Benefits:02,521,4445,041,515 Labor: Analysis, Design and Implementation162,00000 Consultant Fees50,00000 Office Space and Equipment7,00000 Software and Hardware35,00000 Total Development Costs:254,00000 Labor: Webmaster85,00087,55090,177 Labor: Network Technician60,00061,80063,654 Labor: Computer Operations50,00051,50053,045 Labor: Business Manager60,00061,80063,654 Labor: Assistant Manager45,00046,35047,741 Labor: 3 Staff90,00092,70095,481 Software upgrades and licenses4,0001,000 Hardware upgrades5,0003,000 User training2,0001,000 Communications charges20,000 Marketing expenses25,000 Total Operational Costs:446,000452,700464,751 Total Costs:700,000452,700464,751 PV of Costs:679,612426,713425,3131,531,638 PV of all Costs:679,6121,106,3251,531,638 Total Project Costs Less Benefits:(700,000)2,222,3002,288,999 Yearly NPV:(679,612)2,094,7312,094,7583,509,878 Cumulative NPV:(679,612)1,415,1193,509,878 Return on Investment:229.16%(3,509,878/1,531,638) Break-even Point:1.32 years(break-even occurs in year 2; [2,094,731 – 1,415,119] / 2,094,731 = 0.32) Intangible Benefits:Greater brand recognition Improved customer satisfaction")
46
Analysis and Design

47
System Analysis and Design with UML 1.System Analysis 1.Business Process Identification Use Case Diagram 2.Business Process Modeling Activity Diagram or Business Process Modeling Notation (BPMN) 3.Business Process Realization Sequence Diagram (Buat untuk setiap use case dengan menggunakan pola Boundary-Control-Entity) 2.System Design 1.Program Design 1.Class Diagram (Gabungkan Boundary-Control-Entity Class dan susun story dari sistem yang dibangun) 2.Package Diagram (Gabungan class yang sesuai, boleh menggunakan pola B-C-E) 3.Deployment Diagram (arsitektur software dari sistem yang dibangun) 2.User Interface Design (Buat UI design dari Boundary Class) 3.Entity-Relationship Model (Buat ER diagram dari Entity Class)
 3.Business Process Realization Sequence Diagram (Buat untuk setiap use case dengan menggunakan pola Boundary-Control-Entity) 2.System Design 1.Program Design 1.Class Diagram (Gabungkan Boundary-Control-Entity Class dan susun story dari sistem yang dibangun) 2.Package Diagram (Gabungan class yang sesuai, boleh menggunakan pola B-C-E) 3.Deployment Diagram (arsitektur software dari sistem yang dibangun) 2.User Interface Design (Buat UI design dari Boundary Class) 3.Entity-Relationship Model (Buat ER diagram dari Entity Class)")
48
Use Case Diagram

49
Use Case A formal way of representing how a business interacts with its environment The discrete activities performed by the user Use cases are logical models that describe the activities of a system Used to document the As-Is system, or to develop the To-Be system

50
Use Case Diagrams Summarized into a single picture All of the use cases for the part of the system being modeled Use Case Diagram tells what the system will do Good for communicating with users

51
Use Case Diagram Syntax Actor person or system that derives benefit from and is external to the subject Use Case Represents a major piece of system functionality Association Relationship Include Relationship Extend Relationship Generalization Relationship <<extends>> <<includes>>

52
Use Case A major piece of system functionality Can extend other Use Cases Placed inside system boundary Labeled with descriptive verb - noun phrase Use Case

53
System Boundary Includes the name of the system inside or on top Represents the scope of the system Actors are outside the scope of the system Boundary

54
Actor A person or another system that interacts with the current system A role, not a specific user Provides input, receives output, or both actor Actor/Role

55
Association Relationship Links actor and the Use Case Shows two-way communication If one-way, arrows are used * is for "multiplicity of the Association" **

56
Extends Relationship Extends Use Case to include Optional behavior Arrow points from the extension Use Case to the base Use Case extend Make Appointment Make Pmt Arrangements

57
Include Relationship Include one Use Case from within another Arrow points from base Use Case to the included Use Case include Manage Schedule Record Availability

58
Generalization Relationship A specialized Use Case to a more generalized Use Case Arrow points from specialized to general Use Case Make Appointment Make Old Appointment

59
Use Case Diagram for Appointment System

60
Use Case Diagram with Specialized Actor

61
Extend and Include Relationships

62
Studi Kasus: ATM System

63
ATM System

64
Layar Kotak Uang Kotak Kartu Kotak Kuitansi

65
Masukkan PIN: Kotak Uang Kotak Kartu Kotak Kuitansi

66
Menu Utama 1. 1.Melihat Saldo 2. 2.Mentransfer Uang 3. 3.Mengambil Uang 4. 4.Logout Kotak Uang Kotak Kartu Kotak Kuitansi

67
Menu Melihat Saldo 1. 1.Saldo anda adalah …. Kotak Uang Kotak Kartu Kotak Kuitansi

68
Menu Mentransfer Uang 1. 1.No Account Penerima: Kotak Uang Kotak Kartu Kotak Kuitansi

69
Menu Mentransfer Uang 1. 1.Jumlah uang yang dikirim: Kotak Uang Kotak Kartu Kotak Kuitansi

70
Menu Mentransfer Uang 1. 1.Uang berhasil terkirim Kotak Uang Kotak Kartu Kotak Kuitansi

71
Menu Mengambil Uang 1. 1.Jumlah uang yang diambil: Kotak Uang Kotak Kartu Kotak Kuitansi

72
Menu Mengambil Uang Uang berhasil diambil Kotak Uang Kotak Kartu Kotak Kuitansi

73
Use Case Diagram

74
Use Case Diagram (Alternatif)
")
75
Exercise: Business Process Identification 1.Lihat kembali System Request yang sudah anda buat 2.Lakukan business process identification dengan membuatkan Use Case Diagram untuk System Request tersebut

76
Business Process Modeling

77
System Analysis and Design with UML 1.System Analysis 1.Business Process Identification Use Case Diagram 2.Business Process Modeling Activity Diagram or Business Process Modeling Notation (BPMN) 3.Business Process Realization Sequence Diagram (Buat untuk setiap use case dengan menggunakan pola Boundary-Control-Entity) 2.System Design 1.Program Design 1.Class Diagram (Gabungkan Boundary-Control-Entity Class dan susun story dari sistem yang dibangun) 2.Package Diagram (Gabungan class yang sesuai, boleh menggunakan pola B-C-E) 3.Deployment Diagram (arsitektur software dari sistem yang dibangun) 2.User Interface Design (Buat UI design dari Boundary Class) 3.Entity-Relationship Model (Buat ER diagram dari Entity Class)
 3.Business Process Realization Sequence Diagram (Buat untuk setiap use case dengan menggunakan pola Boundary-Control-Entity) 2.System Design 1.Program Design 1.Class Diagram (Gabungkan Boundary-Control-Entity Class dan susun story dari sistem yang dibangun) 2.Package Diagram (Gabungan class yang sesuai, boleh menggunakan pola B-C-E) 3.Deployment Diagram (arsitektur software dari sistem yang dibangun) 2.User Interface Design (Buat UI design dari Boundary Class) 3.Entity-Relationship Model (Buat ER diagram dari Entity Class)")
78
Elements of an Activity Diagram Guidelines for Creating Activity Diagrams Business Process Modeling with Activity Diagrams

79
BPM With Activity Diagrams A number of activities support a business process across several departments Activity diagrams model the behavior in a business process

80
Actions and Activities Performed for a specific business reason Names begin with a verb and end with a noun “Make Appointment” Each activity normally associated with a use case

81
Object Nodes Activity and Actions usually modify objects Object nodes model these objects Objects represent a flow of information from between activities or actions

82
Control & Object Flows Control Flows (solid line) Paths of execution through the business process Can only be attached to actions or activities Object Flows (dashed line) Model the flow of objects through a business process Show actual objects entering and exiting the system An object is on one end, an action or activity is on the other end
 Paths of execution through the business process Can only be attached to actions or activities Object Flows (dashed line) Model the flow of objects through a business process Show actual objects entering and exiting the system An object is on one end, an action or activity is on the other end")
83
Control Nodes 1.Initial – Only one, at top left 2.Final Activity – Stop the process 3.Final Flow – Stop this flow only 4.Decision – Guarded test conditions 5.Merge – Following decisions 6.Fork – Split parallel execution 7.Join – Join parallel execution

84
Swimlanes The business process may be broken into persons of responsibility Identify this with swimlanes

85
Activity Diagram Example

86
Creating Activity Diagrams 1.Set the context or scope of the activity being modeled 2.Identify the activities and control/object flows between activities 3.Identify any decisions made 4.Look for opportunities for parallelism 5.Draw the diagram

87
Business Process Modeling with BPMN

92
Credit Application

93
Purchase Request

94
Shipment Process of a Hardware Retailer

95
The Pizza Collaboration

96
Order Fulfillment and Procurement

97
Studi Kasus: ATM System

98
Activity Diagram: Memasukkan Kartu

99
Activity Diagram: Memasukkan PIN

100
Activity Diagram: Mengecek Saldo

101
Activity Diagram: Mentransfer Uang

102
Activity Diagram: Mengambil Uang

103
Activity Diagram: Melakukan Logout

104
Exercise: Business Process Modeling 1.Lihat kembali System Request yang sudah anda buat 2.Lakukan business process modeling dengan membuatkan Activity Diagram untuk System Request tersebut

105
Business Process Realization

106
System Analysis and Design with UML 1.System Analysis 1.Business Process Identification Use Case Diagram 2.Business Process Modeling Activity Diagram or Business Process Modeling Notation (BPMN) 3.Business Process Realization Sequence Diagram (Buat untuk setiap use case dengan menggunakan pola Boundary-Control-Entity) 2.System Design 1.Program Design 1.Class Diagram (Gabungkan Boundary-Control-Entity Class dan susun story dari sistem yang dibangun) 2.Package Diagram (Gabungan class yang sesuai, boleh menggunakan pola B-C-E) 3.Deployment Diagram (arsitektur software dari sistem yang dibangun) 2.User Interface Design (Buat UI design dari Boundary Class) 3.Entity-Relationship Model (Buat ER diagram dari Entity Class)
 3.Business Process Realization Sequence Diagram (Buat untuk setiap use case dengan menggunakan pola Boundary-Control-Entity) 2.System Design 1.Program Design 1.Class Diagram (Gabungkan Boundary-Control-Entity Class dan susun story dari sistem yang dibangun) 2.Package Diagram (Gabungan class yang sesuai, boleh menggunakan pola B-C-E) 3.Deployment Diagram (arsitektur software dari sistem yang dibangun) 2.User Interface Design (Buat UI design dari Boundary Class) 3.Entity-Relationship Model (Buat ER diagram dari Entity Class)")
107
Sequence Diagram

108
Sequence Diagrams Illustrate the objects that participate in a use case Show the messages that pass between objects for a particular use-case over time

109
Sequence Diagram Syntax AN ACTOR AN OBJECT A LIFELINE A FOCUS OF CONTROL A MESSAGE OBJECT DESTRUCTION anObject:aClass aMessage() aMessage() x
 aMessage() x")
110
Sequence Diagram 1.Susun Sequence Diagram untuk setiap Use Case yang dibuat 2.Mulai dari menarik Actor yang ada di Use Case Diagram, lanjutkan dengan membuat sequence detail dari berjalannya Use Case Catatan: Objek dari Lifeline di Sequence Diagram akan menjadi kandidat Class

111
Jenis Class 1.Boundary Class: 1.Class yang berinteraksi dengan aktor langsung (user interface) 2.Form, input, UI ini masuk di sini 2.Control Class: 1.Class yang berhubungan dengan pemrosesan, penghitungan, kalkulasi, komputasi, query, dst 3.Entity Class: 1.Class yang berhubungan dengan data, penyimpanan data/file
 2.Form, input, UI ini masuk di sini 2.Control Class: 1.Class yang berhubungan dengan pemrosesan, penghitungan, kalkulasi, komputasi, query, dst 3.Entity Class: 1.Class yang berhubungan dengan data, penyimpanan data/file")
112
Studi Kasus: ATM System

113
Sequence Diagram: Memasukkan Kartu

114
Sequence Diagram: Memasukkan PIN

115
Sequence Diagram: Mengecek Saldo

116
Sequence Diagram: Mentransfer Uang

117
Sequence Diagram: Mengambil Uang

118
Sequence Diagram: Melakukan Logout

119
Exercise: Sequence Diagram 1.Lihat kembali System Request, Use Case Diagram, dan Activity Diagram yang sudah anda buat 2.Lengkapi diagram tersebut dengan Sequence Diagram pada setiap Use Case yang dibuat

120
Class Diagram

121
Class Diagram Elements 1.Classes 2.Attributes 3.Operations 4.Relationships

122
Classes Templates for creating instances or objects All objects of a class have same structure and behavior, but contain different attributes 1.Concrete: used to create actual objects 2.Abstract: extended to create other classes

123
Attributes Units of information relevant to the description of the class Only attributes important to the task should be included Attributes should be primitive types (integers, strings, doubles, date, time, Boolean, etc.)
")
124
Operations (Methods) Defines the behavior of the class Action that instances/objects can take Focus on relevant problem-specific operations (at this point)
 Defines the behavior of the class Action that instances/objects can take Focus on relevant problem-specific operations (at this point)")
125
Relationships Generalization “Is-A” relationship Enables inheritance of attributes & oper's Subclasses and superclasses Principle of substitutability Subclass be substituted for superclass Aggregation “Has-A” relationship Relates parts to wholes Uses decomposition

126
Relationships Association Relationships that don't fit “Is-A” or “Has-A” Often a weaker form of “Has-A” Miscellaneous relationships between classes Example: Patient schedules an appointment So the appointment has a patient This is weak

127
Example Class Diagram

128
More on Attributes Derived attributes /age, for example can be calculated from birth date and current date Visibility of attributes +Public: not hidden from any object #Protected: hidden from all but immediate subclasses –Private: hidden from all other classes Default is private

129
More on Operations Constructor: creates object Query: see class state Update: change attribute values Operations can also be public, protected, or private Default for operations is public

130
More on Relationships A primary purpose of class diagrams is to show relationships, or associations, between classes Class can be related to itself (role) Use a "+" sign to show it's a role and not the name of a relationship
 Use a + sign to show it s a role and not the name of a relationship")
131
Relationship Multiplicity Exactly one Zero or more One or more Zero or one Specified range Disjoint ranges Dept Employee Boss Employee Employee Employee Boss Child Employee Spouse Vacation Committee 1..3, 5 2..4 0..1 1..* 0..* 1

132
Class

133
Class with Attribute and Method

134
Class Association

135
Multiplicity

136
Inheritance

137
Interface

138
Studi Kasus: ATM System

139
Class Diagram

140
Exercise: Class Diagram 1.Lihat kembali Activity Diagram, Use Case Diagram, dan Sequence Diagram yang telah anda buat 2.Lanjutkan dengan membuat Class Diagram 3.Masukkan method (message di Sequence Diagram) ke dalam setiap class 4.Generate code secara otomatis dari Class Diagram tersebut
 ke dalam setiap class 4.Generate code secara otomatis dari Class Diagram tersebut")
141
2. Estimating the Size of Software Project

142
Cost Schedule Performance Trade-offsCost SchedulePerformance Project management involves balancing trade-offs among the three key project parameters Project

143
Estimation Trade-offs 1.Size Function points Lines of code Use case points 2.Effort Person-months 3.Time Hours Months

144
Project Estimation Methods Simply Method (Industry Standard Percentages) Use the time spent for planningUse the time spent for planning Along with industry standard percentagesAlong with industry standard percentages Estimate the overall time for the projectEstimate the overall time for the project Function Point (Allen Albrecht, 1979) Estimate System Size (Function Point)Estimate System Size (Function Point) Estimate Effort Required (PM)Estimate Effort Required (PM) Estimate Time Required (M)Estimate Time Required (M) Use Case Point (Gustav Karner, 1993) Estimate System Size (Use Case Points)Estimate System Size (Use Case Points) Estimate Time Required (Hours/Month)Estimate Time Required (Hours/Month) Estimate Effort Required (PM)Estimate Effort Required (PM)
 Use the time spent for planningUse the time spent for planning Along with industry standard percentagesAlong with industry standard percentages Estimate the overall time for the projectEstimate the overall time for the project Function Point (Allen Albrecht, 1979) Estimate System Size (Function Point)Estimate System Size (Function Point) Estimate Effort Required (PM)Estimate Effort Required (PM) Estimate Time Required (M)Estimate Time Required (M) Use Case Point (Gustav Karner, 1993) Estimate System Size (Use Case Points)Estimate System Size (Use Case Points) Estimate Time Required (Hours/Month)Estimate Time Required (Hours/Month) Estimate Effort Required (PM)Estimate Effort Required (PM)")
145
1. Simply Method (Industry Standard Percentages) 1.Use the time spent for planning 2.Along with industry standard percentages 3.Estimate the overall time for the project
 1.Use the time spent for planning 2.Along with industry standard percentages 3.Estimate the overall time for the project.")
146
Time Estimation of SDLC (Industry Standard)
")
147
Time Spent for Planning Phase We are given that so

148
Time Spent for Analysis Phase We are also given that so

149
Estimate the Overall Time Planning Analysis Design Implementation Planning Analysis Design ImplementationIndustryStandard For Web15% 20% 35% 30% ApplicationsEffort Required 4 5.33 9.33 8 in Person (Actual) (Estimated) (Estimated) (Estimated) Months Example: Analysis
 (Estimated) (Estimated) (Estimated) Months Example: Analysis")
150
2. Function Point Approach (Allen Albrecht, 1979)
")
151
1. Function Points Estimation --Step One Complexity DescriptionLow MediumHighTotal Inputs__x 3 __x 4 __x 6____ Outputs__x 4 __x 5__x 7____ Queries__x 3 __x 4__x 6____ Files__x 7 __x 10__x 15____ Program__x 5 __x 7__x 10____ Interfaces TOTAL UNADJUSTED FUNCTION POINTS____

152
Unadjusted Function Points (TUFP)
")
153
Function Points Estimation --Step Two Scale of 1 to 3 Data Communications _____ Heavy Use Configuration _____ Transaction Rate _____ End-User efficiency _____ Complex Processing _____ Installation Ease _____ Multiple sites _____ Performance _____ Distributed functions _____ On-line data entry _____ On-line update _____ Reusability _____ Operational Ease _____ Extensibility _____ Processing Complexity (PC) _____
 _____")
154
Processing Complexity (PC)
")
155
Function Point Estimation -- Step Three Processing Complexity (PC):________ (From Step Two) Adjusted Processing Complexity (PCA) =0.65 + (0.01 * ____ ) Total Adjusted Function Points (TAFP):_____ * ____ = (From Step One) (From Step One)
:________ (From Step Two) Adjusted Processing Complexity (PCA) = (0.01 * ____ ) Total Adjusted Function Points (TAFP):_____ * ____ = (From Step One) (From Step One)")
156
Adjusted Processing Complexity Choose standard Adjusted Project Complexity (PCA) from the range: 1.0.65Simple systems 2.1.0"Normal" systems 3.1.35Complex systems
 from the range: Simple systems Normal systems Complex systems")
157
Total Adjusted Function Points Processing Complexity (PC) = 7 (From Step Two) Adjusted Processing Complexity (PCA) = 0.65 + (0.01 * 7 ) = 0.72 Total Adjusted Function Points (TAFP): 338 * 0.72 = 243 (From Step One) (From Step One)
 = 7 (From Step Two) Adjusted Processing Complexity (PCA) = (0.01 * 7 ) = 0.72 Total Adjusted Function Points (TAFP): 338 * 0.72 = 243 (From Step One) (From Step One)")
158
Converting Function Points to Lines of Code Source: Capers Jones, Software Productivity Research Language LOC/Function Code Point CCOBOLJAVAC++ Turbo Pascal Visual Basic PowerBuilderHTMLPackages (e.g., Access, Excel) 130110 55 55 50 50 30 30 15 15 10-40
")
159
Lines of Codes (LOC) Line of Codes (LOC) = TAFP * LOC/TAFP Example: If TAFP = 243 Then we build the software using Java LOC= (243 * 55) = 13365 line of codes
 Line of Codes (LOC) = TAFP * LOC/TAFP Example: If TAFP = 243 Then we build the software using Java LOC= (243 * 55) = line of codes")
160
2. Estimating Effort Effort is a function of 1.System Size 2.Production Rates amount of work per a given time unit COCOMO model (Barry Boehm) Converts lines of code into person months
 Converts lines of code into person months.")
161
2. COCOMO Estimation Calculation Effort =1.4 * thousands-of- lines-of-code (in Person- Months) Example: If LOC = 2000 Then... Effort = (1.4 * 2) = 2.8 Person Months If LOC = 13365 Then... Effort = (1.4 * 13.365) = 18.711 Person Months
 Example: If LOC = 2000 Then... Effort = (1.4 * 2) = 2.8 Person Months If LOC = Then... Effort = (1.4 * ) = Person Months.")
162
3. Estimating Schedule Time Time = 3.0 * person-months 1/3 (in Months) Example: If LOC = 2000 Then... Effort = (1.4 * 2) = 2.8 person-months 1/3 Time = 3.0 * 2.8 1/3 = 4.2 month If LOC = 13365 Then... Effort = (1.4 * 13.365) = 18.711 person-months 1/3 Time = 3.0 * 18.711 1/3 = 7.9 month
 Example: If LOC = 2000 Then... Effort = (1.4 * 2) = 2.8 person-months 1/3 Time = 3.0 * 2.8 1/3 = 4.2 month If LOC = Then... Effort = (1.4 * ) = person-months 1/3 Time = 3.0 * /3 = 7.9 month.")
163
Exercise: Calculate System Size using FP 1.Hitung system size secara kasar dari artikel berikut dengan menggunakan Function Point 2.TUFP dihitung dari fitur yang muncul secara explicit 3.TAFP dihitung hanya dari perkalian kompleksitas system (pilih apakah simple, average or complex) 4.Hitung effort dan schedule time
 4.Hitung effort dan schedule time")
164
Exercise: Calculate System Size Imagine that job hunting has been going so well that you need to develop a system to support your efforts. The system should allow you to input information about the companies with which you interview, the interviews and office visits that you have scheduled, and the offers that you receive. It should be able to produce reports, such as a company contact list, an interview schedule, and an office visit schedule, as well as produce thank-you letters to be brought into a word processor to customize. You also need the system to answer queries, such as the number of interviews by city and your average offer amount. The system will be developed using Java.

165
Estimating Project Size with Use Case Points

166
Use Case Points Alternative to Function Point Approach Classify actors and use cases as: 1.Simple 2.Average 3.Complex (Gustav Karner, 1993)
")
167
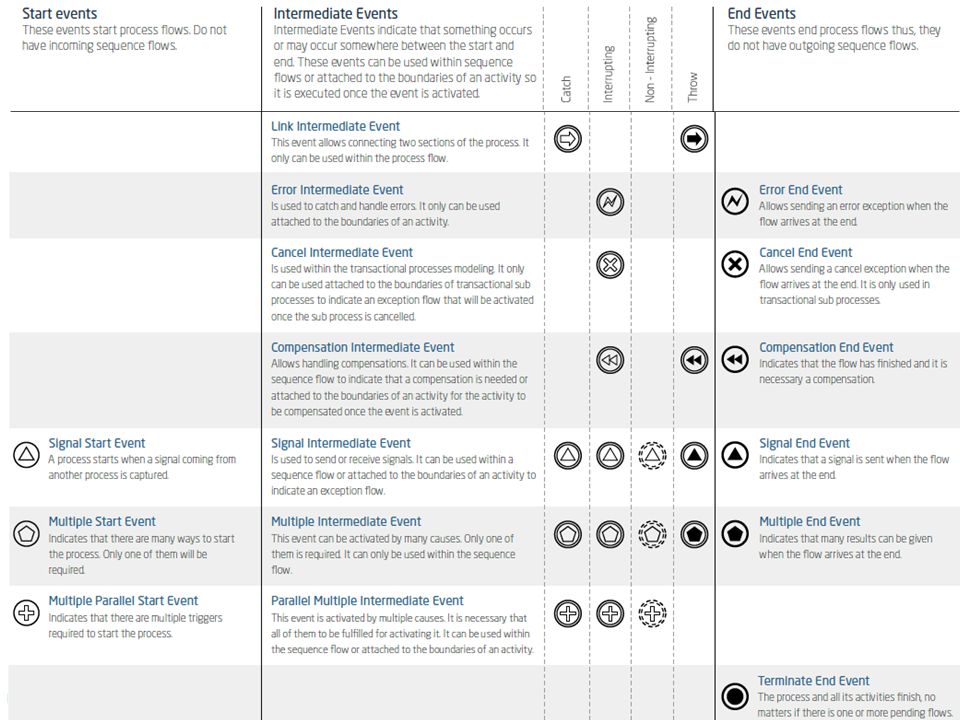
Actor and Use Case Weighting Tables Actor Type DescriptionWeighting Factor SimpleExternal System with well- defined API 1 AverageExternal System using a protocol-based interface, e.g., HTTP, TCT/IP, SQL 2 Comple x Human3 Use-Case Type DescriptionWeighting Factor Simple1-3 transactions5 Average4-7 transactions10 ComplexMore than 7 transactions 15 Unadjusted Use Case Points (UUCP) = UAW + UUCW Unadjusted Use Case Weighting (UUCW) Unadjusted Actor Weighting (UAW)
 = UAW + UUCW Unadjusted Use Case Weighting (UUCW) Unadjusted Actor Weighting (UAW)")
168
Technical Complexity Factors Factor Number DescriptionWeig ht T1Distributed system2.0 T2Response time or throughput performance objectives 1.0 T3End-user online efficiency1.0 T4Complex internal processing1.0 T5Reusability of code1.0 T6Easy to install0.5 T7Ease of use0.5 T8Portability2.0 T9Ease of change1.0 Technical Complexity Factor (TCF) = 0.6 + (0.01 * TFactor)
 = (0.01 * TFactor)")
169
Environmental Compexity Factors Factor Number DescriptionWeight E1Familiarity with system development process in use 1.5 E2Application experience 0.5 E3Object-oriented experience 1.0 E4Lead analyst capability 0.5 E5Motivation 1.0 E6Requirements stability 2.0 E7Part time staff E8Difficulty of programming language Environmental Complexity Factor (ECF) = 1.4 + (-0.03 * EFactor)
 = (-0.03 * EFactor)")
170
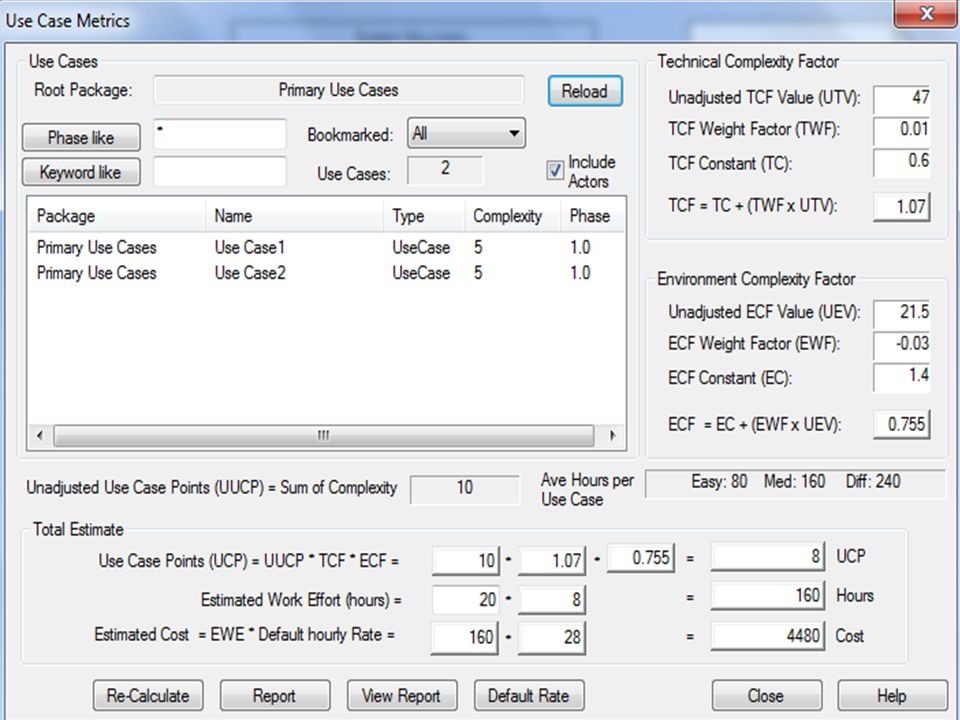
Computing Use Case Points Adjusted Use Case Points (UCP) = UUCP * TCF * ECF Effort in Person Hours = UCP * PHM
 = UUCP * TCF * ECF Effort in Person Hours = UCP * PHM")
171
Person Hour Multiplier (PHM) If the sum of (number of Efactors E1 through E6 assigned value 3) ≤ 2 PHM = 20 Else If the sum of (number of Efactors E1 through E6 assigned value 3) = 3 or 4 PHM 28 Else Rethink project; it has too high of a risk for failure
 If the sum of (number of Efactors E1 through E6 assigned value 3) ≤ 2 PHM = 20 Else If the sum of (number of Efactors E1 through E6 assigned value 3) = 3 or 4 PHM 28 Else Rethink project; it has too high of a risk for failure")
172
Person Hour Multiplier (PHM) Let F1 = Number of E1 to E6 that are < 3 Let F2 = Number of E7 and E8 that are > 3 If F1 + F2 <= 2 PHM = 20 Else if F1 + F2 = 3 or 4 PHM = 28 Else Scrap the project
 Let F1 = Number of E1 to E6 that are < 3 Let F2 = Number of E7 and E8 that are > 3 If F1 + F2 <= 2 PHM = 20 Else if F1 + F2 = 3 or 4 PHM = 28 Else Scrap the project")
173
Use Case Points in EA

175
Effort Estimation from Time Defined PH = 27* 20 = 540 PM = 540/8/22 = 3.06 P/M COCOMO TIME = 3.0 * PM 1/3 TIME = 3.0 * 3.06 1/3 TIME = 3.0 * 1.453 TIME = 4.3 month

176
Effort Estimation from Time Defined PM = 9 P/M TIME = 3.0 * PM 1/3 TIME = 3.0 * 9 1/3 TIME = 3.0 * 2 TIME = 6 month

177
Budget (Custom Software) PekerjaanMan-MonthMonthBudgetTotal Planning115000.00010.000.000 Analysis2110.000.00020.000.000 Design214000.00032.000.000 Implementation423000.00024.000.000 Training214000.000 8000.000 94.000.000
 PekerjaanMan-MonthMonthBudgetTotal Planning Analysis Design Implementation Training")
178
Budget (Generic Software) ProductTotal LMS10.000.000 Teleconference 2.000.000 Chatting 4.000.000 eLibrary20.000.000
 ProductTotal LMS Teleconference Chatting eLibrary")
179
Tugas Selesaikan Sistem Request dan Feasilibility Analysis untuk suatu sistem yang diperlukan di organisasi kita Lanjutkan dengan melakukan System Analysis and Design dengan membuat: 1.Use Case Diagram 2.Sequence Diagram 3.Activity Diagram 4.Class Diagram 5.Data Model 6.User Interface Design (Netbeans)
")
180
Tugas Pahami business process dari sistem di bawah, buat use case diagramnya: OFFLINEONLINE Pilih software berdasar digit terakhir dari NIM 1. 1.Aplikasi Manajemen Klinik 2. 2.Aplikasi Bengkel Mobil 3. 3.Aplikasi Sirkulasi Perpustakaan 4. 4.Aplikasi Pengelolaan Apotik 5. 5.Aplikasi Manajemen Sekolah SD 6. 6.Aplikasi Penjualan Tiket Bioskop 7. 7.Aplikasi Rental Mobil Online 8. 8.Aplikasi Penjualan Laptop Online 9. 9.Aplikasi eLearning 0. Aplikasi Penjualan Tiket Kereta Online

181
Tugas Lakukan pengembangan software dengan mengikuti 10 proses pengembangan software, untuk studi kasus di bawah: Pilih software berdasar digit terakhir dari NIM Buat laporan lengkap pengembangan software dalam format DOC, dengan disertai folder project netbeans, file design (.EAP), dan dumped database (.SQL) Email to: romi@brainmatics.com dengan subject email: [SE2- UNIVERSITAS] NIM - Namaromi@brainmatics.com Deadline: 3 minggu Nyontek dan kerjasama = 0 1. 1.Aplikasi Rental DVD 2. 2.Aplikasi Penjualan Tiket Bioskop 3. 3.Aplikasi Penjualan Handphone 4. 4.Aplikasi Peminjaman Komik 5. 5.Aplikasi Rental Motor 6. 6.Aplikasi Penjualan Buku 7. 7.Aplikasi Rental Kendaraaan 8. 8.Aplikasi Registrasi Mata Kuliah 9. 9.Aplikasi Peminjaman Buku 0. Aplikasi Penjualan Tiket Kereta
![Tugas Lakukan pengembangan software dengan mengikuti 10 proses pengembangan software, untuk studi kasus di bawah: Pilih software berdasar digit terakhir dari NIM Buat laporan lengkap pengembangan software dalam format DOC, dengan disertai folder project netbeans, file design (.EAP), dan dumped database (.SQL) to: dengan subject [SE2- UNIVERSITAS] NIM - Deadline: 3 minggu Nyontek dan kerjasama = 0 1.](http://images.slideplayer.com/10/2894081/slides/slide_181.jpg "1.Aplikasi Rental DVD 2. 2.Aplikasi Penjualan Tiket Bioskop 3. 3.Aplikasi Penjualan Handphone 4. 4.Aplikasi Peminjaman Komik 5. 5.Aplikasi Rental Motor 6. 6.Aplikasi Penjualan Buku 7. 7.Aplikasi Rental Kendaraaan 8. 8.Aplikasi Registrasi Mata Kuliah 9. 9.Aplikasi Peminjaman Buku 0. Aplikasi Penjualan Tiket Kereta.")
182
Referensi (Foundation) Roger S. Pressman, Software Engineering: A Practitioner’s Approach Sevent Edition, McGraw-Hill, 2009 Ian Sommerville, Software Engineering 9th Edition, Addison-Wesley, 2010 Albert Endres dan Dieter Rombach, A Handbook of Software and Systems Engineering, Pearson Education Limited, 2003 Yingxu Wang, Software Engineering Foundations: A Software Science Perspective, Auerbach Publications, Taylor & Francis Group, 2008 Guide to the Software Engineering Body of Knowledge 2004 Version (SWEBOK), IEEE Computer Society, http://www.swebok.org, 2004
, IEEE Computer Society,")
183
Referensi (Process) Alan Dennis et al, Systems Analysis and Design with UML – 3 rd Edition, John Wiley and Sons, 2010 Dan Pilone and Russ Miles, Head First Software Development, O’Reilly Media, 2008 Barclay and Savage, Object-Oriented Design with UML and Java, Elsevier, 2004 Paul Kimmel, UML Demystified, McGraw-Hill, 2005 Kim Hamilton and Russell Miles, Learning UML 2.0, O'Reilly, 2006 Howard Podeswa, UML for the IT Business Analyst, Course Technology, 2009 Deloitte, Business Process Modeling – Basic Guideline and Tips, 2008
 Alan Dennis et al, Systems Analysis and Design with UML – 3 rd Edition, John Wiley and Sons, 2010 Dan Pilone and Russ Miles, Head First Software Development, O’Reilly Media, 2008 Barclay and Savage, Object-Oriented Design with UML and Java, Elsevier, 2004 Paul Kimmel, UML Demystified, McGraw-Hill, 2005 Kim Hamilton and Russell Miles, Learning UML 2.0, O Reilly, 2006 Howard Podeswa, UML for the IT Business Analyst, Course Technology, 2009 Deloitte, Business Process Modeling – Basic Guideline and Tips, 2008")
184
Referensi (Quality Assurance) Daniel Galin, Software Quality Assurance, Addison- Wesley, 2004 Jeff Tian, Software Quality Engineering, John Wiley & Sons, Inc., 2005 G. Gordon Schulmeyer, Handbook of Software Quality Assurance Fourth Edition, Artech House, 2008 Kshirasagar Naik and Priyadarshi Tripathy, Software Testing and Quality Assurance, John Wiley & Sons, Inc., 2008

Similar presentations


 – Part One Ku-Yaw Chang Assistant Professor.>")


