Download presentation
Presentation is loading. Please wait.

1
The Chemical Composition of the Solar System and the Earth

2
Two suggestions Expertise comes from making all possible mistakes (Niels Bohr) Nothing can be obtained in geochemistry without careful analytical work (C.J. Allegre)
")
3
Further readings W.M. White, Geochemistry. A on-line text book.
S.R. Taylor and S.M., The Continental Crust: Its Composition and Evolution. Blackwell, Oxford. W.F. McDonough and S.Sun, The Composition of the Earth, Chemical Geology, 120: Geochemical Earth Reference Model (GERM)
")
4
Why do we study element abundances?
Fundamental for any geochemical studies

5
Confusing terms Abundance: for a large system, e.g., Cosmos, Sun, Moon, Earth, crust, regional crust Content/concentration: for a smaller system, e.g., rocks, minerals, natural water.

6
Part 1 The Solar/Cosmic system

7
Sources for studies Meteorite Sun’s Photosphere Cosmic rays
Earth and moon

8
Classification of meteorites according to texture and chemical composition (White, 2001)
")
9
Relative abundance of major types of meteorite falls

11
Characteristics of chondrite groups
Carbonaceous chondrites are the most volatile-rich and the most primitive.

12
Condensation sequence of a gas with a solar composition

13
Condesation sequence of minerals

14
Goldschmidt’s classification of elements

15
Classification of elements (McDonough and Sun, 1995)
")
16
Classification of elements according to volatility

17
Ca-Al inclusion There is much interest in high T component, i.e., the so-called Refractory Inclusions (RI) or Ca-Al inclusions (CAI), because their composition represents that of the first condensates from a high T gas.
 or Ca-Al inclusions (CAI), because their composition represents that of the first condensates from a high T gas.")
18
Carton illustrating the process involved in formation of chondrites and their components

19
Abundances of elements in sun’s photosphere vs their abundances in CI chondrites (White, 2001)
")
20
Comparison of element abundances in solar photosphere and CI carbonaceous chondrites (Taylor and McLennan, 1995)
")
22
Solar system abundances of elements relative to Si=10-6

24
Characteristic of element abundances of the solar system
H and He accounts for 98% in mass. Exponential decrease in abundance for elements with atomic number<45. Elements with even mass show significantly higher abundances than the neighboring elements with odd mass. He exhibit an abnomously high abundance compared to the neighboring Li, Be and B. O and Fe show a peak. Isotopes with atomic weight being factor of 4 have high abundance. 4He (Z=2, N=2), 16O (Z=8, N=8), 40Ca (Z=20, N=20).
, 16O (Z=8, N=8), 40Ca (Z=20, N=20).")
25
Even-odd mass effect 58 60 66 64 70 57 68 62 59 63 67 65 71 69

26
Sequence of decreasing element abundances in the solar system
HHeOCN, NeMg, SiFeS 1010 to 109 107 106 105

27
Neocleosynthesis The Big Bang

28
Steller structure at the onset of supernova stage (White, 2001)
The E-process (Si burning) The S-process (neutron capture) The r-process (Rapid neutron capture) Principle mechanism for forming heavier isotopes The p-process (Proton capture) Responsible for the lightest isotopes of a given element
 The S-process (neutron capture) The r-process (Rapid neutron capture) Principle mechanism for forming heavier isotopes. The p-process (Proton capture) Responsible for the lightest isotopes of. a given element.")
29
The r-process path

30
Part 2 The Moon

31
Representative compositions of lunar rocks

32
Comparison of the composition of the Moon and the Earth

33
Highlights of lunar Geochronology

34
Part 3 The Earth

35
Volumes and masses of the Earth’s shells

36
The Earth’s Interior Mantle: Peridotite (ultramafic)
Upper to 410 km (olivine ® spinel) Low Velocity Layer km Transition Zone as velocity increases ~ rapidly 660 spinel ® perovskite-type SiIV ® SiVI Lower Mantle has more gradual velocity increase Figure 1-2. Major subdivisions of the Earth. Winter (2001) An Introduction to Igneous and Metamorphic Petrology. Prentice Hall.
 Low Velocity Layer km. Transition Zone as velocity increases ~ rapidly. 660 spinel ® perovskite-type. SiIV ® SiVI. Lower Mantle has more gradual velocity increase. Figure 1-2. Major subdivisions of the Earth. Winter (2001) An Introduction to Igneous and Metamorphic Petrology. Prentice Hall.")
37
The Earth’s Interior Core: Fe-Ni metallic alloy Outer Core is liquid
No S-waves Inner Core is solid Figure 1-2. Major subdivisions of the Earth. Winter (2001) An Introduction to Igneous and Metamorphic Petrology. Prentice Hall.
 An Introduction to Igneous and Metamorphic Petrology. Prentice Hall.")
38
Figure 1-3. Variation in P and S wave velocities with depth
Figure 1-3. Variation in P and S wave velocities with depth. Compositional subdivisions of the Earth are on the left, rheological subdivisions on the right. After Kearey and Vine (1990), Global Tectonics. © Blackwell Scientific. Oxford.
, Global Tectonics. © Blackwell Scientific. Oxford.")
39
Part 3-1 The mantle

40
Methods of studies Mantle xenoliths entrained by volcanic rocks
Massif peridotite: Exhumed mantle slab Mantle-derived volcanic rocks Experiments at high P-T Seismic and density properties

41
Mantle Rock Types

42
Rock Names Peridotite: ultramafic rock composed of olivine, 2 pyroxenes (opx-cpx) and Al-phase (i.e., plagioclase, spinel, garnet, with the specific phase being a function of pressure, 0-10, 10-25, >25 Kb respectively), includes: lherzolite, harzburgite, dunite
 and Al-phase (i.e., plagioclase, spinel, garnet, with the specific phase being a function of pressure, 0-10, 10-25, >25 Kb respectively), includes: lherzolite, harzburgite, dunite.")
43
Eclogite: mafic (i.e., basaltic) rock composed of Na-rich clinopyroxene and garnet
 rock composed of Na-rich clinopyroxene and garnet")
44
Pyroxenite: mafic to ultramafic rock, dominantly composed of pyroxene, often containing an Al-phase (e.g., plagioclase, spinel, garnet)
")
45
Non-Rock Names Primitive Mantle/Silicate Earth: model composition for the crust + mantle. Pyrolite: model composition for the primitive mantle, name derived from pyroxene-olivine-ite. Piclogite: model composition for the mantle, name derived from picritic-eclogite (picrite = olivine-rich basalt).
.")
46
Lherzolite: A type of peridotite with Olivine > Opx + Cpx
Dunite 90 Peridotites Wehrlite Harzburgite Lherzolite 40 Olivine Websterite Pyroxenites Orthopyroxenite 10 Websterite 10 Clinopyroxenite Orthopyroxene Clinopyroxene Figure 2-2 C After IUGS

47
Mantle rock mineral assemblage
Simple: 4 or 5 phases Olivine (Ol) Orthopyroxene (OPX) Clinopyroxene (CPX) Plagioclase (Pl) Spinel (Sp) Garnet (Gt)
 Orthopyroxene (OPX) Clinopyroxene (CPX) Plagioclase (Pl) Spinel (Sp) Garnet (Gt)")
48
Composition of rocks Pyrolite harzburgite lherzolite eclogite SiO2 45
46 44 50 Al2O3 4.5 1.2 2.2 16 FeO 8.0 7.3 8.2 10 MgO 38 41 8 CaO 3.6 0.9 *Mg# 89.4 91.5 89.9 58.8 *density r 3.385 3.346 3.376 3.970 olivine 56 62 65 -- orthopyx 18 30 21 clinopyx 2 garnet 14 6

49
Modal and physical property for lithospheric mantle of different ages (After O’Reilly et al., 2001)
")
50
Mantle Phase Diagrams

51
Phase diagram for aluminous 4-phase lherzolite:
Al-phase = Plagioclase shallow (< 50 km) Spinel 50-80 km Garnet km Si ® VI coord. > 400 km Note: the mantle will not melt under normal ocean geotherm! Figure Phase diagram of aluminous lherzolite with melting interval (gray), sub-solidus reactions, and geothermal gradient. After Wyllie, P. J. (1981). Geol. Rundsch. 70,
 Spinel km. Garnet km. Si ® VI coord. > 400 km. Note: the mantle will not melt under normal ocean geotherm! Figure 10-2 Phase diagram of aluminous lherzolite with melting interval (gray), sub-solidus reactions, and geothermal gradient. After Wyllie, P. J. (1981). Geol. Rundsch. 70,")
52
Mantle phase diagram

53
Phase assemblages and 1 atm density

54
Melting of Mantle Melt: Basalt Residue: Peridotite

55
Lherzolite is probably fertile unaltered mantle
Dunite and harzburgite are refractory residuum after basalt has been extracted by partial melting 15 Tholeiitic basalt 10 Partial Melting Wt.% Al2O3 5 Figure 10-1 Brown and Mussett, A. E. (1993), The Inaccessible Earth: An Integrated View of Its Structure and Composition. Chapman & Hall/Kluwer. Lherzolite Harzburgite Residuum Dunite 0.0 0.2 0.4 0.6 0.8 Wt.% TiO2
, The Inaccessible Earth: An Integrated View of Its Structure and Composition. Chapman & Hall/Kluwer. Lherzolite. Harzburgite. Residuum. Dunite Wt.% TiO2.")
56
How does the mantle melt??
1) Increase the temperature No realistic mechanism for the general case Local hot spots OK very limited area Figure Melting by raising the temperature.
 Increase the temperature. No realistic mechanism for the general case. Local hot spots OK. very limited area. Figure Melting by raising the temperature.")
57
2) Lower the pressure Adiabatic rise of mantle with no conductive heat loss Decompression melting could melt at least 30% Adiabatic rise of mantle with no conductive heat loss Steeper than solidus Intersects solidus D slope = heat of fusion as mantle melts Decompression melting could melt at least 30% Figure Melting by (adiabatic) pressure reduction. Melting begins when the adiabat crosses the solidus and traverses the shaded melting interval. Dashed lines represent approximate % melting.
 pressure reduction. Melting begins when the adiabat crosses the solidus and traverses the shaded melting interval. Dashed lines represent approximate % melting.")
58
3) Add volatiles (especially H2O)
Remember solid + water = liq(aq) and LeChatelier Dramatic lowering of melting point of peridotite Figure Dry peridotite solidus compared to several experiments on H2O-saturated peridotites.
 and LeChatelier. Dramatic lowering of melting point of peridotite. Figure Dry peridotite solidus compared to several experiments on H2O-saturated peridotites.")
59
Experiments on melting enriched vs. depleted mantle samples:
Tholeiite easily created by 10-30% PM More silica saturated at lower P Grades toward alkalic at higher P Figure 10-17a. Results of partial melting experiments on depleted lherzolites. Dashed lines are contours representing percent partial melt produced. Strongly curved lines are contours of the normative olivine content of the melt. “Opx out” and “Cpx out” represent the degree of melting at which these phases are completely consumed in the melt. After Jaques and Green (1980). Contrib. Mineral. Petrol., 73,
. Contrib. Mineral. Petrol., 73,")
60
Experiments on melting enriched vs. depleted mantle samples:
2. Enriched Mantle Tholeiites extend to higher P than for DM Alkaline basalt field at higher P yet And lower % PM Figure 10-17b. Results of partial melting experiments on fertile lherzolites. Dashed lines are contours representing percent partial melt produced. Strongly curved lines are contours of the normative olivine content of the melt. “Opx out” and “Cpx out” represent the degree of melting at which these phases are completely consumed in the melt. The shaded area represents the conditions required for the generation of alkaline basaltic magmas. After Jaques and Green (1980). Contrib. Mineral. Petrol., 73,
. Contrib. Mineral. Petrol., 73,")
62
Melting of mantle T,P

63
CaO-Al2O3 plot showing the range of mantle composition of different ages (O’Reilly et al., 2001)
DEPLETION

64
Lherozlite from Hannuoba, North China Craton

65
Deepest mantle samples from transition zone: Majorite-Bearing Xenoliths from Malaita,Ontong Java Oceanic Plateau- 9.5 GPa (260 km) to 22 GPa (570 km). Collerson et al., 2000, Science, 288:

66
Estimating pressure of garnet and majorite

67
Mantle phase diagram

68
Common lherzolite xenoliths come from a depth of 50-80 km: lithosphere

69
Phase diagram for aluminous 4-phase lherzolite:
Al-phase = Plagioclase shallow (< 50 km) Spinel 50-80 km Garnet km Si ® VI coord. > 400 km Note: the mantle will not melt under normal ocean geotherm! Figure Phase diagram of aluminous lherzolite with melting interval (gray), sub-solidus reactions, and geothermal gradient. After Wyllie, P. J. (1981). Geol. Rundsch. 70,
 Spinel km. Garnet km. Si ® VI coord. > 400 km. Note: the mantle will not melt under normal ocean geotherm! Figure 10-2 Phase diagram of aluminous lherzolite with melting interval (gray), sub-solidus reactions, and geothermal gradient. After Wyllie, P. J. (1981). Geol. Rundsch. 70,")
70
Structure of lithosphere
Nyblade, 2001

71
Lithosphere evolution in eastern North China craton (After O’Reilly et al., 2001)
")
72
Estimation of Primitive Mantle Composition

73
Mantle model circa 1975 Homogeneous mantle Large-scale convection (drives plate tectonics?) Figure 10-16a After Basaltic Volcanism Study Project (1981). Lunar and Planetary Institute.
. Lunar and Planetary Institute.")
74
Newer mantle model Upper depleted mantle = MORB+ crust sources
Lower undepleted & enriched OIB source Layered mantle Upper depleted mantle = MORB source depleted by MORB extraction > 1 Ga Lower = undepleted & enriched OIB source Boundary = 670 km phase transition Sufficient D density to impede convection so they convect independently It is interesting to note that this concept of a layered mantle was initiated by the REE concentrations of oceanic basalts Later support came from isotopes and geophysics Figure 10-16b After Basaltic Volcanism Study Project (1981). Lunar and Planetary Institute.
. Lunar and Planetary Institute.")
76
Primitive vs metasomatism
Primitive: Flat REE Metasomatism: LREE enriched

77
REE distribution of peridotite showing effect of mantle metasomatism
z b g S p P m v 1 2 - L N d E T D y H Y Chondrite normalization

78
Criteria for estimating Primitive Mantle Composition
Should have refractory lithophile element ratios that are similar to CI chondrite.

79
Variations with MgO in peridotite

80
Constant refractory element ratios in peridotites

81
Elemental ratios in chondritic meteorites (McDonough and Sun, 1995)
")
82
Variation of refractory lithophile element ratios in peridotites (McDonough and Sun, 1995)
")
83
Estimating refractory lithophile elements in bulk silicate Earth (McDonough and Sun, 1995)
")
84
Estimates of Silicate Earth -Major elements

85
Estimates of Silicate Earth -Trace elements

86
Abundances of elements in Primitive mantle compared to CI condrites

87
Part 3-2 The Core and Bulk Earth

88
The Earth’s Interior Core: Fe-Ni metallic alloy Outer Core is liquid
No S-waves Inner Core is solid Figure 1-2. Major subdivisions of the Earth. Winter (2001) An Introduction to Igneous and Metamorphic Petrology. Prentice Hall.
 An Introduction to Igneous and Metamorphic Petrology. Prentice Hall.")
89
Composition of the Core
Poorly constrained beyond its major constituents (i.e., an Fe-Ni alloy). Presence of 5-15% of light element(s) (S, O, Si). The dominant depository of siderophile elements in the Earth.
. Presence of 5-15% of light element(s) (S, O, Si). The dominant depository of siderophile elements in the Earth.")
90
Limits on the compositions of the core and bulk Earth (McDonough & Sun, 1995)
")
91
Liquid silicate-liquid metal partition coefficients

92
Comparison of element distributions in the Earth and carbonaceous chondrites
The Earth is more strongly depleted in volatile elements

93
Figure 1-5. Relative atomic abundances of the seven most common elements that comprise 97% of the Earth's mass. An Introduction to Igneous and Metamorphic Petrology, by John Winter , Prentice Hall.

94
Part 3-3 The Oceanic crust

95
The Earth’s Crust Oceanic crust Continental Crust Thin: 10 km
Relatively uniform stratigraphy = ophiolite suite: Sediments pillow basalt sheeted dikes more massive gabbro ultramafic (mantle) Continental Crust Thicker: km average ~35 km Highly variable composition Average ~ granodiorite
 Continental Crust. Thicker: km average ~35 km. Highly variable composition. Average ~ granodiorite.")
96
Methods of study Ophiolite Ocean drilling Seismic studies

97
Structure of oceanic crust

98
Plate Tectonics – Igneous Genesis
1. Mid-ocean Ridges 2. Intracontinental Rifts 3. Island Arcs 4. Active Continental Margins 5. Back-arc Basins 6. Ocean Island Basalts 7. Miscellaneous Intra- Continental Activity kimberlites, carbonatites, anorthosites...

99
Composition of the Oceanic Crust (Taylor and McLennan, 1995)
")
100
Part 3-4 The Continental crust
The continental crust accounts for 41% of the Earth surface. Approximately 31% of continental area is submerged beneath the oceans.

101
Importance of Determining Crustal Composition
Basic constraints on evolution of the Earth. Most accessible part of the Earth and the best known. Place for formation of most of ore deposits. Important depository for highly incompatible elements (U, K, Cs). Essential for environmental studies and geochemical exploration.
. Essential for environmental studies and geochemical exploration.")
102
Study of the composition of the continental crust can be traced back to earliest stage of geochemical studies F.M.Clarke, 1889 F.M.Clarke and H.S.Washington, 1924 V.M.Goldschmidt,1933, who is regarded as the father of modern geochemistry. S.R.Taylor, 1994 D.M.Shaw, 1967 S.R.Taylor and S.M. McLennan, 1985 K.H.Wedepohl, 1992

103
What is the Continental Crust ?
Extends vertically from the surface to the Mohorovicic discontinuity, a jump in compressional wave Vp speeds from ~7 km/s to ~8 km/s that is interpreted to mark the crust-mantle boundary. Stratification in seismic velocity and thus rock type and chemical composition. Lateral and vertically heterogeneous and great diversity in rock type.

104
Structure and compositional model of the continental crust (Wedepohl, 1995)
")
105
Metamorphic Facies Lower Crust Middle Crust Upper crust
Fig Temperature-pressure diagram showing the generally accepted limits of the various facies used in this text. Boundaries are approximate and gradational. The “typical” or average continental geotherm is from Brown and Mussett (1993). Winter (2001) An Introduction to Igneous and Metamorphic Petrology. Prentice Hall. Middle Crust The boundaries between metamorphic facies represent T-P conditions in which key minerals in mafic rocks are either added or removed, thus changing the mineral assemblages observed They are thus separated by mineral reaction isograds The limits are approximate and gradational, because the reactions vary with rock composition and the nature and composition of the fluid phase The 30oC/km geothermal gradient is an example of an elevated orogenic geothermal gradient. Upper crust
. Winter (2001) An Introduction to Igneous and Metamorphic Petrology. Prentice Hall. Middle Crust. The boundaries between metamorphic facies represent T-P conditions in which key minerals in mafic rocks are either added or removed, thus changing the mineral assemblages observed. They are thus separated by mineral reaction isograds. The limits are approximate and gradational, because the reactions vary with rock composition and the nature and composition of the fluid phase. The 30oC/km geothermal gradient is an example of an elevated orogenic geothermal gradient. Upper crust.")
106
Part 3-4-1 The Upper Continental Crust : the most accessible part of the Earth

107
Methods of Studies Large-scale regional sampling (e.g., the Canadian Shield) Using fine-grained clastic sediments
 Using fine-grained clastic sediments.")
108
Large-scale regional sampling
Examples: The Canadian Shield and Eastern China. The most reliable method for upper crustal composition estimation. The only method for major element composition studies. Expensive and time-consuming. Not pertain to the study of upper crustal composition in the geological history.

109
Sampling in Eastern China

111
Fine-Grained Clastic Sediments as Natural Sampling of the Exposed Upper Continental Crust
Shale, mudstone, siltstone, graywack, tillite, and loess. Simple and much less expensive. The only way for studying upper crustal composition in geological history. Unsuitable to providing the major element composition. Limited to REE, Y, Th, Sc, Co.

112
Geological influences on sedimentary rock composition-Solubility
Water-upper crust partition coefficient: Ky=Natural water/Upper crust Seawater residence time y: time for replacement of seawater element concentration. y=My/Fy where My is the mass of element y in the oceans and Fy is the annual mean flux of element y through the ocean reservoir.

113
Residence time vs seawater partition coefficients

114
Weathering Ca, Na and Sr are lost K, Rb, Cs and Ba are retained.
Al, Ga, HSFE (Ti, Zr, Hf, Ta, Th) and REE, Y, Sc are immobile.
 and REE, Y, Sc are immobile.")
115
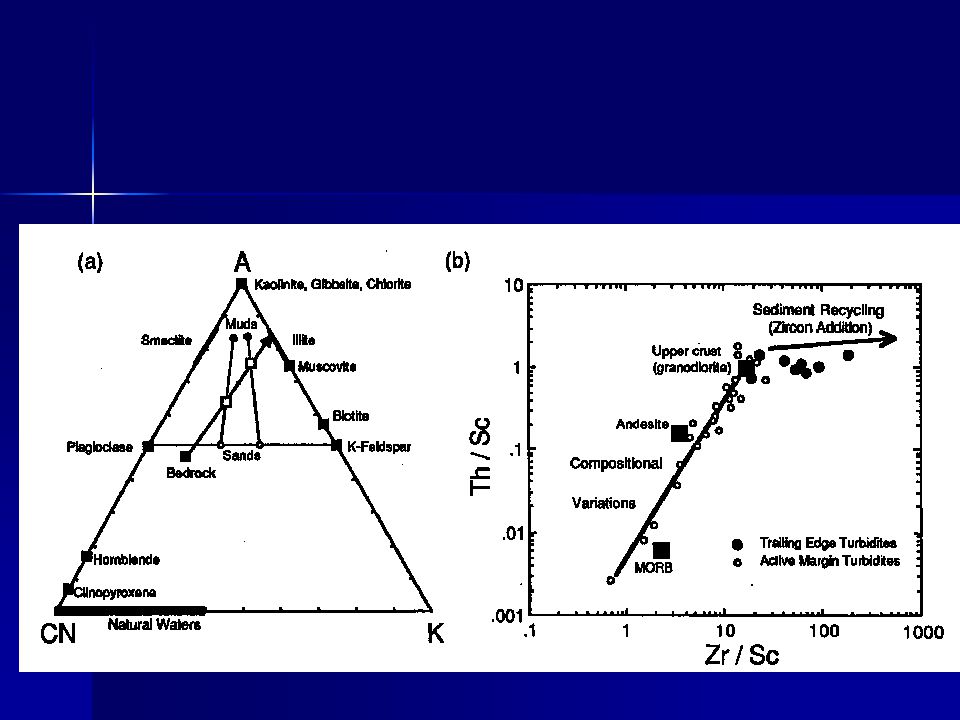
CIA: Chemical Index of Alteration CIA=Al2O3/(Al2O3+CaO
CIA: Chemical Index of Alteration CIA=Al2O3/(Al2O3+CaO*+Na2O+K2O) in molecular proportion Plagioclase is the dominant phase in the continental crust subjected to weathering.
 in molecular proportion. Plagioclase is the dominant phase in the continental crust subjected to weathering.")
117
Erosion and transportation
The sand-size effect. Quartz and heavy minerals (zircon, rutile, magnetite, chromite) are enriched in sandstone.
 are enriched in sandstone.")
118
Diagenesis Sensitive to redox conditions
Fe and Mn are soluble in anoxic conditions. Fe, Cu, Mo, Pb, Zn, V, Ni, S, C are clearly enriched in anoxic sediments due to incorporation in sulphides and/or absorption on organic compounds. U is enriched also in anoxic sediments due to reduction of soluble 6+U to insoluble 4+U.

119
Metamorphism Poorly understood. Li and Pb may increase.
Most elements and particularly REE, Y, Th, HFSE, Cr and Sc are immobile.

120
Sedimentary rocks as crustal samples
Insoluble elements (log 4; Ksw -4) are likely to be transferred almost quantitatively into clastic sediments and give the best information regarding the source-exposed upper crust.
 are likely to be transferred almost quantitatively into clastic sediments and give the best information regarding the source-exposed upper crust.")
121
Quantitatively transferred into fine-grained clastic sediments
REE in fine-grained sediments provide quantitative info on the upper crust composition Quantitatively transferred into fine-grained clastic sediments

122
REE comparison of shales and upper crust

123
Constant element ratios in the upper crust

127
Estimation of upper crustal composition
Major elements: large-scale sampling Trace elements: large-scale sampling fine-grained clastic sediments using REE and their ratios to other elements

128
Various upper crustal major element estimates
Taylor & McLennan Shaw et al. Wedepohl Condie Gao et al. Rudnick & Gao 1985 1967 1995 1993 1998 2002 SiO2 66 64.93 66.21 65.46 65.84 TiO2 0.5 0.52 0.55 0.65 0.60 Al2O3 15.2 14.63 14.96 13.65 14.31 FeOT 4.50 3.97 4.70 5.13 4.92 MnO 0.07 0.068 0.1 0.10 MgO 2.2 2.24 2.42 2.52 2.47 CaO 4.2 4.12 3.6 3.31 3.46 Na2O 3.9 3.51 2.75 3.13 K2O 3.4 3.1 2.73 2.58 2.66 H2O 0.79 2.11 P2O5 0.2 0.15 0.12 0.14 Total 100.17 97.98 98.80 98.41 99.71

129
Upper crustal compositional estimates (Taylor and McLennan, 1985)
")
130
Comparison of loess and upper crustal compositions (Taylor and McLennan, 1985)
")
131
Part The deep crust

132
Methods of Studies Amphibolite- and granulite-facies xenoliths entrained mostly in basalts. Exposed deep crustal sections Correlation of seismic velocities of rocks with lithologies Heat flow constraints

133
Crustal structure based on deep crusal xenoliths (Mengel et al., 1992)
")
134
Deep Crustal Xenoliths
Mostly granulite-facies

135
Histogram of SiO2 in granulite xenoliths
(Rudnick, 1992)
")
136
Exposed Deep Crustal Section

137
Model for exposed deep crustal cross-section (Percival and Fountain, 1992)
")
138
P-wave and Poisson’s ratio structure along the exposed Kapuskasing deep crustal section (Percival and Fountain, 1994) P-wave velocity (km) Poisson’s ratio
 Poisson’s ratio.")
139
Contrasts between granulite xenoliths and terrain granulites
麻 粒 岩 地 体 麻 粒 岩 包 体 时 代 太古- 元古宙 后太古宙 压 力 MPa MPa 深 度 25-35 km 35-50 km 岩 性 中性和长英质为主 镁铁质-超镁铁质为主 SiO2 55-75% 40-55%

140
Correlation of seismic velocities with rock types
Compressional P-wave velocity (Vp) Shear S-wave velocity (Vs) Poisson’s ratio () =0.5{1 – 1/[(Vp/Vs)2 – 1]}
 Shear S-wave velocity (Vs) Poisson’s ratio () =0.5{1 – 1/[(Vp/Vs)2 – 1]}")
141
Measurement of seismic velocities of rocks

142
Calculation of velocities in depth
V(z)=V(0) + [(dV/dP)T P + (dV/dT)PT]dz Where V(0) and V(z) are velcities at a reference state and at depth z. For common rocks, (dV/dP)T =210-4 to 710-4 km s-1 MPa-1; (dV/dT)P = -210-4 to -610-4 km s-1 C-1
=V(0) + [(dV/dP)T P + (dV/dT)PT]dz. Where V(0) and V(z) are velcities at a reference state and at depth z. For common rocks, (dV/dP)T =210-4 to 710-4 km s-1 MPa-1; (dV/dT)P = -210-4 to -610-4 km s-1 C-1.")
143
Effect of heat flow on Vp (Rudnick and Fountain, 1995)
")
144
150 MPa 下侵入岩Vp随成分的变化 (Fountain and Christensen, 1989)
")
145
Relation between SiO2 and Vp of granulites (Rudnick and Fountain, 1995)
")
146
Density vs Vp Peridotite Eclogite Mafic granulite

147
1、蛇纹岩 2、石英岩 3、花岗岩 4、花岗闪长岩 5、角闪岩相长英质片麻岩 6、石英云母片岩 7、绿片岩相变辉长岩 8、辉长岩 9、斜长角闪岩 1、长英质角闪片麻岩 2、长英质片麻岩 3、中性麻粒岩 4、斜长岩 5、镁铁质麻粒岩 6、斜长角闪岩 7、麻粒岩相变泥质岩 8、辉石岩 9、榴辉岩 10、纯橄榄岩/二辉橄榄岩 Holbrook et al. (1992)
")
148
Crustal structure in various tectonic settings (Rudnick and Fountain, 1995)
")
149
Normative mineral composition of continental crust (Taylor and McLennan, 1995)
")
151
Comparison of upper, middle and lower crust compositions (Rudnick and Fountain, 1995)
")
152
Relation between Continental Crust and MORB

154
Comparison of various REE and trace element estimates of continental crust (Rudnick and Fountain, 1995)
")
155
Comparison of continental crust and various basalts (Hoffmann, 1994)
")
156
Compositional characteristics of continental crust
The upper crust is granitic with 66% SiO2 and with a significant negative Eu anomaly. The middle crust is tonalitic with 61% SiO2. The lower crust is mafic in many regions with ~52% SiO2 and may be more evolved for some cratons (e.g., North China Craton) and collision belts. Relative depletion in Nb and enrichment in Pb characterize the continental crust and continental crustal rocks- “the arc signature”. The total continental crust has an andesitic/granodioritic bulk composition with 59-62%. It contains a significant proportion of the bulk silicate Earth’s incompatible element budget (33-35% of Rb, Ba, K, Pb, Th and U).
 and collision belts. Relative depletion in Nb and enrichment in Pb characterize the continental crust and continental crustal rocks- the arc signature . The total continental crust has an andesitic/granodioritic bulk composition with 59-62%. It contains a significant proportion of the bulk silicate Earth’s incompatible element budget (33-35% of Rb, Ba, K, Pb, Th and U).")
157
Schematic model for growth and evolution of the continental crust (Taylor and McLennan, 1995)
")
158
Total Continental Crust
La Ce Pr Nd Sm Eu Gd Tb Dy Ho Er Tm Yb Lu 1 10 100 Rock/Chondrite East China (this study; Eu/Eu*=0.80) Wedepohl (1995; Eu/Eu*=0.83) Rudnick & Fountain (1995; Eu/Eu*=0.98) Taylor & McLennan (1995; Eu/Eu*=1.00) Total Continental Crust
 Wedepohl (1995; Eu/Eu*=0.83) Rudnick & Fountain (1995; Eu/Eu*=0.98) Taylor & McLennan (1995; Eu/Eu*=1.00) Total Continental Crust.")
159
Relative Vp change with depth under varying surface heat flows

160
Contrasting lower crustal velocities for Archean and Proterozoic provinces (Durrheim and Mooney, 1991)
")
161
The following slides are not used in the lectures

162
Generation of tholeiitic and alkaline basalts from a chemically uniform mantle
Variables (other than X) Temperature Pressure Variables (other than X) Temperature = % partial melting Pressure Fig indicates that, although the chemistry may be the same, the mineralogy varies Pressure effects on eutectic shift Figure Phase diagram of aluminous lherzolite with melting interval (gray), sub-solidus reactions, and geothermal gradient. After Wyllie, P. J. (1981). Geol. Rundsch. 70,
 Temperature. Pressure. Variables (other than X) Temperature. = % partial melting. Pressure. Fig indicates that, although the chemistry may be the same, the mineralogy varies. Pressure effects on eutectic shift. Figure 10-2 Phase diagram of aluminous lherzolite with melting interval (gray), sub-solidus reactions, and geothermal gradient. After Wyllie, P. J. (1981). Geol. Rundsch. 70,")
163
Liquids and residuum of melted pyrolite
Tholeiite produced at < 30 km depth by 25% PM 60 km Alkalis are incompatible so tend to concentrate in first low % partial melts 20% PM -> alkaline basalt 30% PM -> tholeiite (only 25% or less at 30 km so looks like tholeiitic nature suppressed with depth) Note that residuum is Ol + Opx (harzburgite) Note also the thermal divide between thol and alk at low pressure for FX Figure 10-9 After Green and Ringwood (1967). Earth Planet. Sci. Lett. 2,
 Note that residuum is Ol + Opx (harzburgite) Note also the thermal divide between thol and alk at low pressure for FX. Figure 10-9 After Green and Ringwood (1967). Earth Planet. Sci. Lett. 2,")
164
Initial Conclusions: Tholeiites favored by shallower melting
25% melting at <30 km ® tholeiite 25% melting at 60 km ® olivine basalt Tholeiites favored by greater % partial melting 20 % melting at 60 km ® alkaline basalt incompatibles (alkalis) ® initial melts 30 % melting at 60 km ® tholeiite
 ® initial melts. 30 % melting at 60 km ® tholeiite.")
165
Crystal Fractionation of magmas as they rise
Tholeiite ® alkaline by FX at med to high P Not at low P Thermal divide Al in pyroxenes at Hi P Low-P FX ® hi-Al shallow magmas (“hi-Al” basalt) Figure Schematic representation of the fractional crystallization scheme of Green and Ringwood (1967) and Green (1969). After Wyllie (1971). The Dynamic Earth: Textbook in Geosciences. John Wiley & Sons.
 Figure Schematic representation of the fractional crystallization scheme of Green and Ringwood (1967) and Green (1969). After Wyllie (1971). The Dynamic Earth: Textbook in Geosciences. John Wiley & Sons.")
166
Primary magmas Formed at depth and not subsequently modified by FX or Assimilation Criteria Highest Mg# (100Mg/(Mg+Fe)) really ® parental magma Experimental results of lherzolite melts Mg# = 66-75 Cr > 1000 ppm Ni > ppm Multiply saturated

167
Summary A chemically homogeneous mantle can yield a variety of basalt types Alkaline basalts are favored over tholeiites by deeper melting and by low % PM Fractionation at moderate to high depths can also create alkaline basalts from tholeiites At low P there is a thermal divide that separates the two series In spite of this initial success, there is evidence to suggest that such a simple approach is not realistic, and that the mantle is chemically heterogeneous

168
REE data for oceanic basalts
Ocean Island Basalt (Hawaiian alkaline basalt) Looks like partial melt of ~ typical mantle Mid Ocean Ridge Basalt (tholeiite) How get (+) slope?? increasing incompatibility Figure 10-13a. REE diagram for a typical alkaline ocean island basalt (OIB) and tholeiitic mid-ocean ridge basalt (MORB). From Winter (2001) An Introduction to Igneous and Metamorphic Petrology. Prentice Hall. Data from Sun and McDonough (1989).
 Looks like partial melt of ~ typical mantle. Mid Ocean Ridge Basalt (tholeiite) How get (+) slope increasing incompatibility. Figure 10-13a. REE diagram for a typical alkaline ocean island basalt (OIB) and tholeiitic mid-ocean ridge basalt (MORB). From Winter (2001) An Introduction to Igneous and Metamorphic Petrology. Prentice Hall. Data from Sun and McDonough (1989).")
169
Spider diagram for oceanic basalts
Same approach for larger variety of elements Still OIB looks like partial melt of ~ typical mantle MORB still has (+) slope Looks like two mantle reservoirs MORB source is depleted by melt extraction OIB source is not depleted is it enriched? increasing incompatibility Figure 10-13b. Spider diagram for a typical alkaline ocean island basalt (OIB) and tholeiitic mid-ocean ridge basalt (MORB). From Winter (2001) An Introduction to Igneous and Metamorphic Petrology. Prentice Hall. Data from Sun and McDonough (1989).
 slope. Looks like two mantle reservoirs. MORB source is depleted by melt extraction. OIB source is not depleted. is it enriched increasing incompatibility. Figure 10-13b. Spider diagram for a typical alkaline ocean island basalt (OIB) and tholeiitic mid-ocean ridge basalt (MORB). From Winter (2001) An Introduction to Igneous and Metamorphic Petrology. Prentice Hall. Data from Sun and McDonough (1989).")
170
REE data for UM xenoliths
LREE enriched LREE depleted or unfractionated REE data for UM xenoliths LREE depleted or unfractionated LREE enriched Depleted types (+) slope Fertile types (-) slope Enriched? Figure Chondrite-normalized REE diagrams for spinel (a) and garnet (b) lherzolites. After Basaltic Volcanism Study Project (1981). Lunar and Planetary Institute.
 slope. Fertile types (-) slope. Enriched Figure Chondrite-normalized REE diagrams for spinel (a) and garnet (b) lherzolites. After Basaltic Volcanism Study Project (1981). Lunar and Planetary Institute.")
171
Cross-section of a subduction zone

172
俯冲板片的熔融和大陆地壳的形成 Whinter (2001)
")
173
The Geothermal Gradient
Continental Gradient higher than Oceanic Gradient Range for both Highest at Surface water and cold surface In the future we will often use average values rather than the ranges Figure 1-9. Estimated ranges of oceanic and continental steady-state geotherms to a depth of 100 km using upper and lower limits based on heat flows measured near the surface. After Sclater et al. (1980), Earth. Rev. Geophys. Space Sci., 18,
, Earth. Rev. Geophys. Space Sci., 18,")
174
Fig Temperature- pressure diagram showing the three major types of metamorphic facies series proposed by Miyashiro (1973, 1994). Winter (2001) An Introduction to Igneous and Metamorphic Petrology. Prentice Hall. The high P/T series, for example, typically occurs in subduction zones where “normal” isotherms are depressed by the subduction of cool lithosphere faster than it can equilibrate thermally The facies sequence here is (zeolite facies) - (prehnite- pumpellyite facies) - blueschist facies - eclogite facies. The medium P/T series is characteristic of common orogenic belts (Barrovian type) The sequence is (zeolite facies) - (prehnite-pumpellyite facies) - greenschist facies -amphibolite facies - (granulite facies) Crustal melting under water-saturated conditions occurs in the upper amphibolite facies (the solidus is indicated in Fig. 25-2) The granulite facies, therefore, occurs only in water-deficient rocks, either dehydrated lower crust, or areas with high XCO2 in the fluid
 - (prehnite- pumpellyite facies) - blueschist facies - eclogite facies. The medium P/T series is characteristic of common orogenic belts (Barrovian type) The sequence is (zeolite facies) - (prehnite-pumpellyite facies) - greenschist facies -amphibolite facies - (granulite facies) Crustal melting under water-saturated conditions occurs in the upper amphibolite facies (the solidus is indicated in Fig. 25-2) The granulite facies, therefore, occurs only in water-deficient rocks, either dehydrated lower crust, or areas with high XCO2 in the fluid.")
177
Earth’s earliest history (in Ma)
")
178
Upper mantle phase diagram

179
Craton vs off-craton differences

180
Craton vs off- craton differences

181
Craton vs off- craton differences

182
Craton vs off- craton differences

183
Craton vs off-craton differences

184
Heat flow constrains

185
Heat flow structure

186
Incompatible lithophile element distributions caused by removal of basaltic melt from primitive mantle (Carlson, 1994)
")
187
REE comparison of various shales and upper crustal estimates

188
SiO2 distribution in granulites Rudnick and Fountain (1995)
")
189
Comparison of present and paleo-position of exposed crustal sections (Fountain et al., 1990)
")
190
Average Poisson’s ratio vs SiO2 for major rock types (Christensen, 1996)
")
191
0 km 14 km 24 km 32 km 37 km Bulk Lower Crust Total Crust Vp=6.9 km/s
UPPER CRUST MIDDLE LOWER LOWERMOST 14 km 24 km 32 km 37 km 0 km Sedimentary and Volcanic Rocks Granitoids Low-grade Metamorphic Rocks Vp=6.4 km/s SiO2=62% 90% TTGG gneiss 10% Amphibolite Vp=6.7 km/s SiO2=58% 100% intermediate granulite or 75% felsic+25%mafic granulite Vp=7.1 km/s, SiO2=52% Mafic granulite Bulk Lower Crust 53% Mafic granulite 47% Felsic granulite Vp=6.9 km/s SiO2=55-57% (52%, 7.14 km/s; R & F, 1995) Vp=6.0 km/s SiO2=65% Total Crust SiO2=62-64% (59%, 6.67 km/s; R & F, 1995)
 Vp=6.0 km/s. SiO2=65% Total Crust. SiO2=62-64% (59%, 6.67 km/s; R & F, 1995)")
192
Comparison of Sr-Nd isotopic composition of basalts (Hofmann, 1994)
")
193
REE mobility in weathering profile

195
REE distributions of heavy minerals

196
Effect of zircon addition

197
Effect of allanite addition

198
Effect of monazite addition

199
Interpretation of sedimentary Nd model ages in terms of sedimentary recyling

200
Nd vs Th/Sc for various modern sediments

201
Models for origin of plumes (Hofmann, 1994)
")
203
REE patterns for selected modern sediments

204
Effect of zircon enrichment

205
REE patterns of modern and Phanerozoic turbidites

206
Moder turbidite muds and Australian shales

207
Early Proterzoic sedimentary rocks from northern New Mexico and southern Corolado

209
REE pattern of seawater

210
Ce/Ce* variation of seawter and clastic sediments with tectonic setting

211
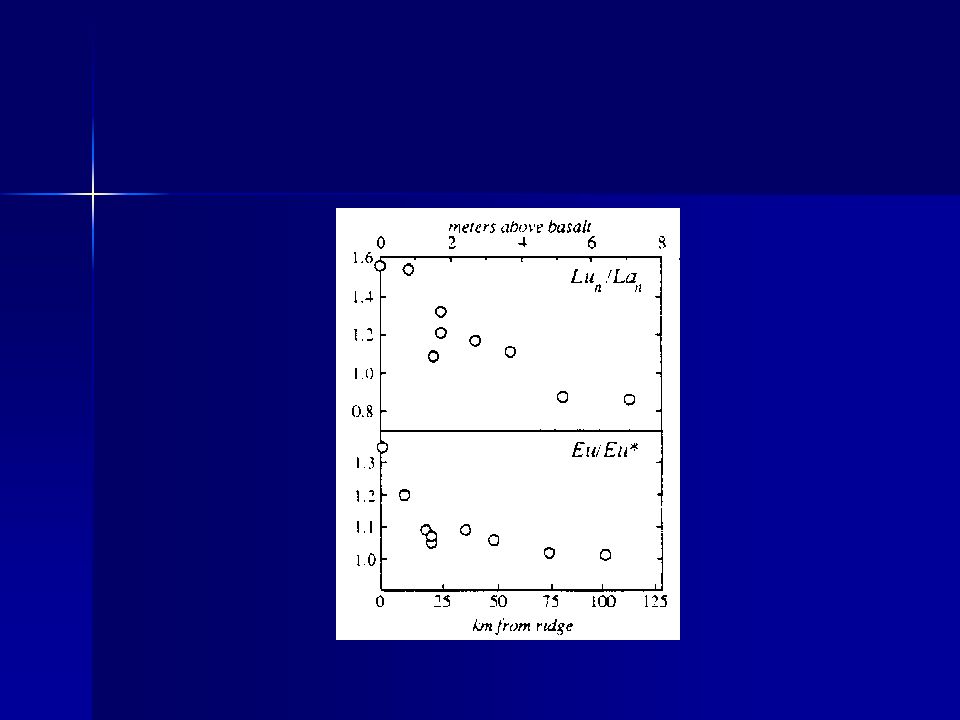
Chemical variation of sediments from spreading ridge

212
Variation of REE patterns with stratigraphic order

213
Variation of REE from ridge

216
Tectonic map of China (李献华)
")
217
(据李献华)
")
218
扬子克拉通南缘沉积岩Nd随时代的变化(李献华)
")
223
Effect of monazite addition

224
Diagenetic chemical fractionation during formation of chert

228
REE patterns of Eu-enriched turbidite sandstone

Similar presentations


 for Carbonatitic and Potassic Lavas from SW Uganda G. N. Eby 1, F. E. Lloyd 2, A. R. Woolley 3, F. Stoppa 4 1 Dept. Envir.,>")


(10 27 g) Earth1.0835.98100.>")


 of lherzolite Model for mid-ocean ridges 3.Melting in.>")

