Download presentation
Presentation is loading. Please wait.

1
GRADIENT:Himalayan elevation gradient NICHE: temperature niches Richness Endemics Life forms

4
But first: do communities exist?

5
A short answer after a long debate: No. Compositional variation in nature tends to be gradual.

6
How can we analyse species composition? PinusTsuga Site 1310 Site 251 Site 302 Site 448 Site 535........... Within some defined environment or area we sample a number of plots and register the species present

7
The temperature niche Habitat is where plant live, e.g. in oak forest, on open slopes, at rhododendron trees, etc Distribution range is where on a geogrphical one may find the target species

8
Elevation gradient variation in temperature and correlated variables e.g. soilMontaneConiferousForest DeciduousForest AlpineTundra Temperated Forest Northern Coniferous Forest Arctic Tundra lowhighElevation

9
Laps rate = 0.55 o C pr 100 elevation-meter

10
ELEVATION GRADIENT SPCECIES OCCURE AND DISAPEAR Low-land sp Mid elevation High-land sp M ASL

11
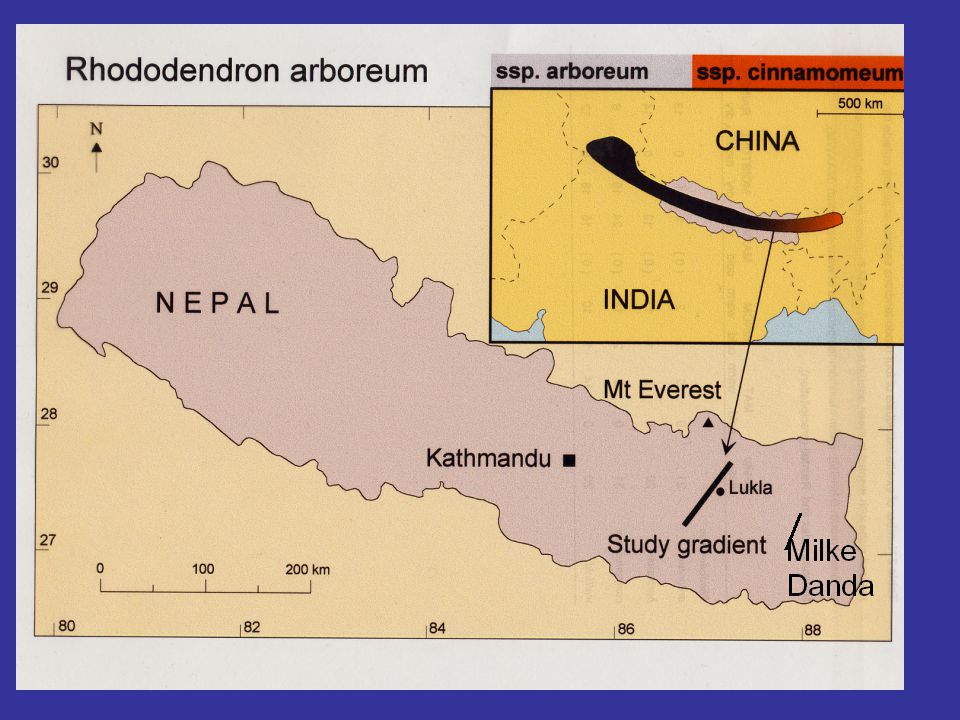
ELEVATIONE RANGE ELEVATION CONVERTED TO TEMPERATURE EXAMPLES: RHODODENDRON IN THE HIMALAYAS

13
1000 masl Elevation range of Rh. Arboreum 3600 masl

14
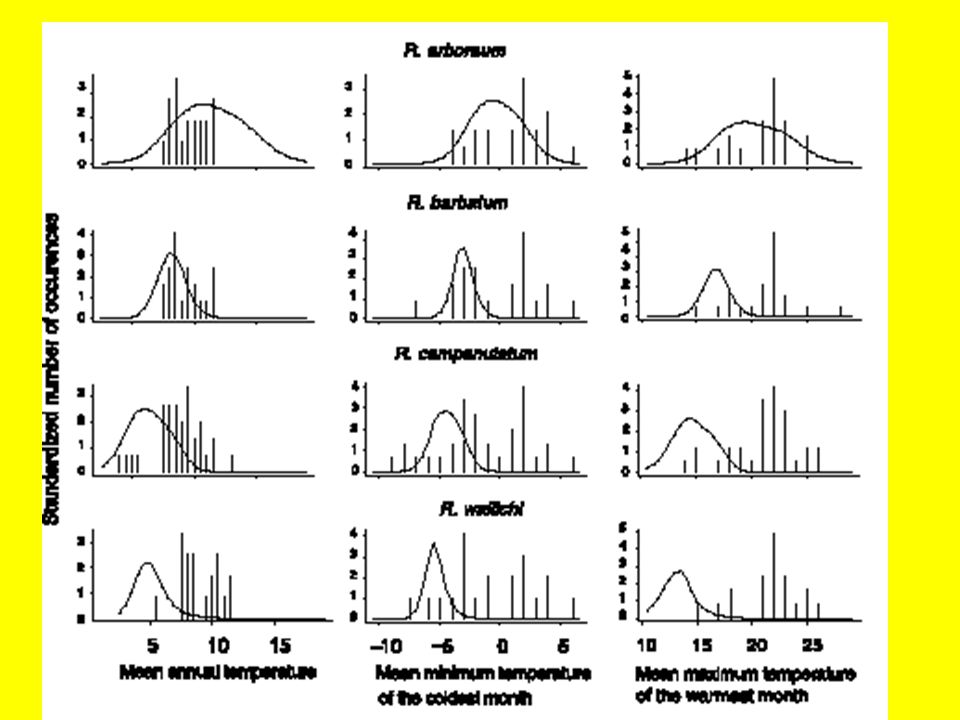
Concepts: realized and potential niche Realized climate niche = the average climate conditions where the species are growing in nature Potential climate niche = the climate conditions where the (fundamental) species are able to grow without interference from other organisms temperature abundance
 species are able to grow without interference from other organisms temperature abundance")
15
Elevation gradient in temperature lapse rate= decrease 0.5 degrees Celsius each 100 elevation meter MontaneConiferousForest DeciduousForest AlpineTundra Subtropical Forest Northern Arctic Tundra lowhighElevation

18
species100200300400500….6000 sp1001100 sp2111110 sp3000110 sp n-1000010 sp n000000 sum of spp112330 INTERPOLATION : ASSUMING ALL SPECIES ARE PRESNET IN ALL 100M INTERVALS BETWEEN LOWER AND UPPER ELEVATION LIMIT This gives total number of specie in all different elevation bands from 100 m to 6000 m a.s.l.

19
INTERPOLATION : ASSUMING ALL SPECIES ARE PRESNET IN ALL 100M INTERVALS BETWEEN LOWER AND UPPER ELEVATION LIMIT This gives total number of species in all different elevation bands from 100 m to 6000 m a.s.l. This can be done for different life forms, such as ferns,trees or total number of endemics and total number of species

20
Tree species richness patterns Unimodal relationship between tree species richness and elevation. Maximum tree species found between 900 and 1000 m. Elevation Species richness

22
Mountain Biomes “Islands” = isolation= speciation, polyploidy => endemics “Islands” = isolation= speciation, polyploidy => endemics

23
Internpolated species richness in the Himalayas

24
Interpolated species richness in the Himalayas Plateau MASL

25
1500 200 m asl

26
Is Gamma diversity able to predict the pattern of Alpha diversity along an elevation range? Ole R. Vetaas, M. Panthi, & K. Shrestha, IE Maaren Centre for Development Studies, University of Bergen, Nygaardsgt. 5, N-5015 Bergen, NORWAY. Central Department of Botany, Tribhuvan University, P.B. 5927 Kathmandu, Nepal.

30
Elevation GradientConiferousForest DeciduousForest Ice & rock AlpineTundra TROPICAL FOREST Northern Coniferous Forest Arctic Tundra low high Elevation TROPICALFOREST EVERGREENOAK-RHODODENDRON-Forest MontaneBETULA&……

32
elevation gradientConiferousForest DeciduousForest Ice & rock AlpineTundra TROPICAL FOREST Northern Coniferous Forest Arctic Tundra low high Elevation TROPICALFOREST EVERGREENOAK-RHODODENDRON-Forest MontaneBETULA&…… 2000 m asl 4000 m asl

33
elevation gradientConiferousForest DeciduousForest Ice & rock AlpineTundra TROPICAL FOREST Northern Coniferous Forest Arctic Tundra low high Elevation TROPICALFOREST EVERGREENOAK-RHODODENDRON-Forest MontaneBETULA&……

34
Rh. arboreum spp. arboreum Rh. arboreum spp. cinnamomeum

35
elevation gradientConiferousForest DeciduousForest Ice & rock AlpineTundra TROPICAL FOREST Northern Coniferous Forest Arctic Tundra low high Elevation TROPICALFOREST EVERGREENOAK-RHODODENDRON-Forest MontaneBETULA&……

36
Area: Manag 3200 – 4000 masl Sampling: 5 plots (10m x10m) in each 100m elevation on N- and S- aspects of the valley
 in each 100m elevation on N- and S- aspects of the valley")
37
elevation gradientConiferousForest DeciduousForest Ice & rock AlpineTundra TROPICAL FOREST Northern Coniferous Forest Arctic Tundra low high Elevation TROPICALFOREST EVERGREENOAK-RHODODENDRON-Forest MontaneBETULA&…… BETULA

38
Dry inner valleys

39
ANNAPURNA RANGE MONSOON

41
Dry south-exposed slopes

42
Alpine shrub at 3800+ masl

43
Diversity concepts Two of late R.H. Whittakers diversity concepts Alpha diversity number of species in community, i.e. # species per area (point-alpha) Gamma diversity not well-defined concept, high alpha and high beta produce high gamma.
 Gamma diversity not well-defined concept, high alpha and high beta produce high gamma..")
44
Gamma diversity? Lomolino defined Gamma diversity as total number of species in certain elevations zone in a mountain range. Similar to the concept of Species pool, which is indicating the potential number of species that could be found in a given area.

45
Interpolated species richness in the Himalayas MASL We used data on elevation ranges in the Enumeration of flowering plants in Nepal (Hara et al., 1978;Hara & Williams, 1979; Hara et al., 1982) to describe the pattern of species richness along the elevation gradient. GAMMA diversity~ species pool

46
Interpolated species richness in the Himalayas Plateau MASL

47
LOCATION OF THE PLOTS

48
Alpha diversity number of species per 100 square metre Species richness was recorded from 350 10m x 10m plots: 2000 - 4000 m asl Average species richness (alpha diversity) for each 100 m elevation zone Sources: Vetaas, Maaren, KB Shrestah, M Panthi, and Ohasi H. (The Flora of eastern Himalaya)
.")
49
Species pool for each 100m elevation interval = Gamma diversity

50
Average alpha diversity in 100 square metre plots for each 100m elevation interval

51
41% Deviance explained 38% Deviance explained

52
There is a significant drop in richness from the evergreen oak forest and deciduous forest at 2500 m asl to the marginal boreal zone with dominance of coniferous trees. This appear both in gamma level and alpha level Thus the gamma level can predict the alpha level, at least the pattern of change

53
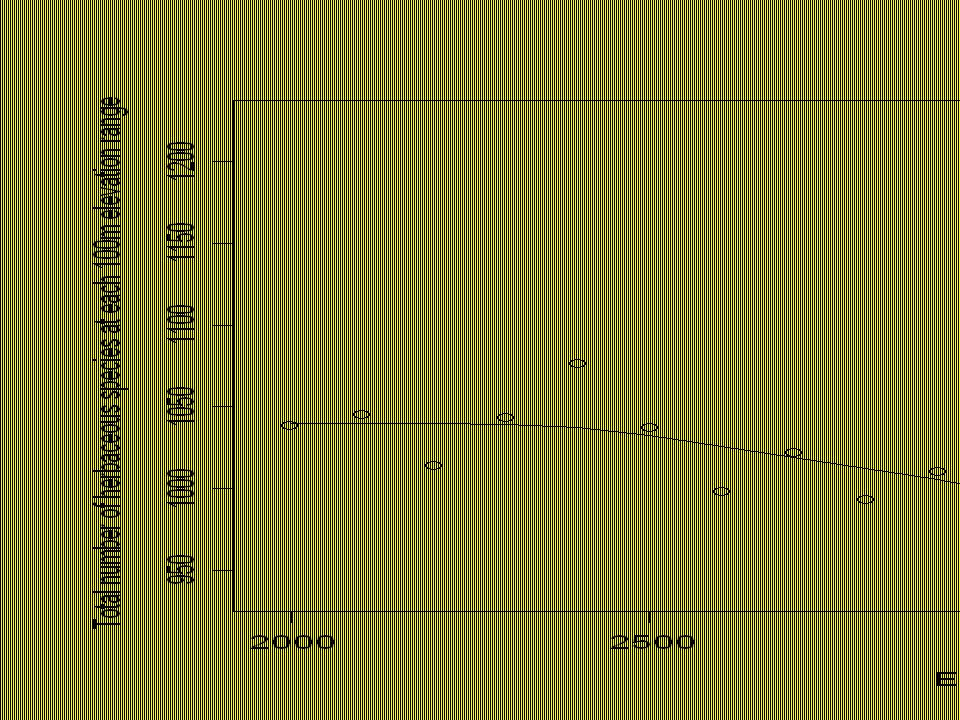
The plateau ? Gamma diversity also indicate a plateau This is found in alpha level But Tree species gamma does not predict this Herbaceous species gamma does!

54
Tree species richness patterns Unimodal relationship between tree species richness and elevation. Maximum tree species found between 900 and 1000 m. No plateau in 3000 – 4000 m asl. Dispersal of herbaceous species Elevation Species richness

56
Herbaceous gamma explain 22 % of the deviance in total Alpha

57
What cause these patterns? Drop in richness Increased change in temperature Laps rate break!

58
Temperature decreases at a faster rate above 3000 m U-valley with glaciers 9 of 12 points are colder than laps rate estimate

59
Dry south-exposed slopes PLATEAU Geology : U-valley Domestic animals seed dispersal

60
CONCLUSIONS Gamma diversity estimates are useful to detect pattern and deduce hypothesis that can be tested by field sampling Example here: The drop in richness form evergreen forest to ‘boreal’ sub-alpine coniferous forest Plateau in richness in the coniferous dominated U-valley of the arid central Himalayas.

Similar presentations


 c and z are fitting parameters.>")


. What is ecology, & what do ecologists do? 2). What are the four levels of organization of ecology? 3). What are four main factors that.>")
: any form of life – population: a group of interacting individuals of same species – community: populations.>")


 Climate- particularly temperature and.>")

