Download presentation
Presentation is loading. Please wait.

1
Diabetes and Renal Disease
Dr Anne Kleinitz KRSS GP 12/11/2009 1

2
Learning Objectives Type 1 vs Type 2 DM Diabetes Management
Diabetic Complications Diabetic Nephropathy & ESKD 2

3
Type 1 Vs Type 2 DM 3

4
Type 1 Type 2 Young Older **** Overweight Thin Insulin resistant
Insulin deficient (pancr. islet cell loss) Acute presentation Ketoacidosis Insulin initially Type 2 Older **** Overweight Insulin resistant (excess fat cell mass) Delayed diagnosis Diet & pills Insulin later or never 4
 Acute presentation. Ketoacidosis. Insulin initially. Type 2. Older **** Overweight. Insulin resistant. (excess fat cell mass) Delayed diagnosis. Diet & pills. Insulin later or never. 4.")
5
Type 1 Type 2 Onset Acute (symptomatic) Slow or insidious
Clinical features Weight loss Polyuria Polydipsia Obese/over wt Strong FHx Ethnicity PCOS Ketosis Often present Usually absent Insulin (endog) Low or absent Normal or Antibodies + ve ve Assoc. autoimmune disorders Yes No 5
 Low or absent. Normal or Antibodies. + ve. ve. Assoc. autoimmune disorders. Yes. No. 5.")
6
6

7
Type 1 Immune destruction of insulin producing cells in pancreas
leading to insulin deficiency. Prevalence General population 12 – 17% Indigenous 1% Acute onset, usually early in life 7

8
Type 2 Tissue resistance to insulin + defects in insulin secretion
Gradual onset. One end of spectrum: Insulin resistance but normal glucose tolerance Impaired fasting glucose (IFG) Impaired glucose tolerance “pre-diabetes” (IGT) Type 2 DM 8
 Impaired glucose tolerance pre-diabetes (IGT) Type 2 DM. 8.")
9
Normal IFG IGT Diabetes Fasting <5.5 5.5 – 6.9 and < 7 and ≥ 7.0
2 hr post 75g glucose <7.8 7.8 – 11 ≥11.1 Random < 5.5 ≥ 11.1 9

10
Q. More common in T2 than T1? Age < 20 years Overweight
High levels of blood insulin Prone to ketoacidosis Albuminuria at time of diagnosis 10

11
Q. More common in T2 than T1? Age < 20 years NO** Overweight YES
High levels of blood insulin YES Prone to ketoacidosis NO Albuminuria at time of diagnosis YES 11

12
Prevalance (estimated) Indigenous
Australia - 7.5% (but ½ unDx!) Indigenous > 25 yrs 10 – 30% 3 – 4 x higher than general population Higher in remote communities Hospital admission for DM more common 12 x higher rates eg. Gestational DM Contributes to CVD – 67% with DM died of CVD ( ) Renal failure is also a common cause of death 12
 Indigenous. > 25 yrs 10 – 30% 3 – 4 x higher than general population. Higher in remote communities. Hospital admission for DM more common. 12 x higher rates eg. Gestational DM. Contributes to CVD – 67% with DM died of CVD ( ) Renal failure is also a common cause of death. 12.")
13
Age-adjusted Percentage of U. S
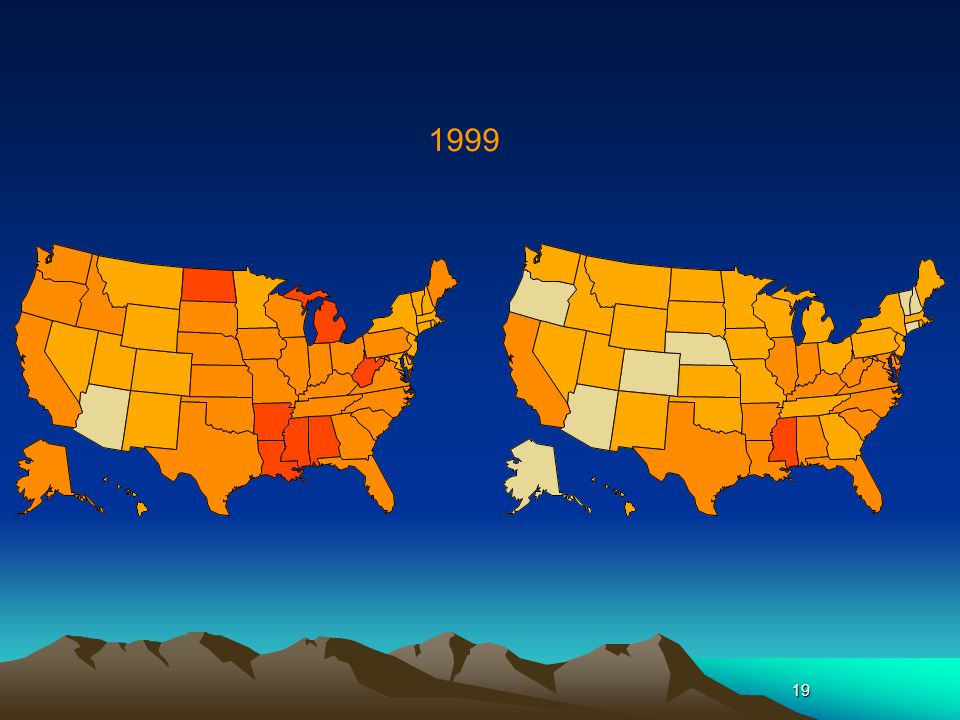
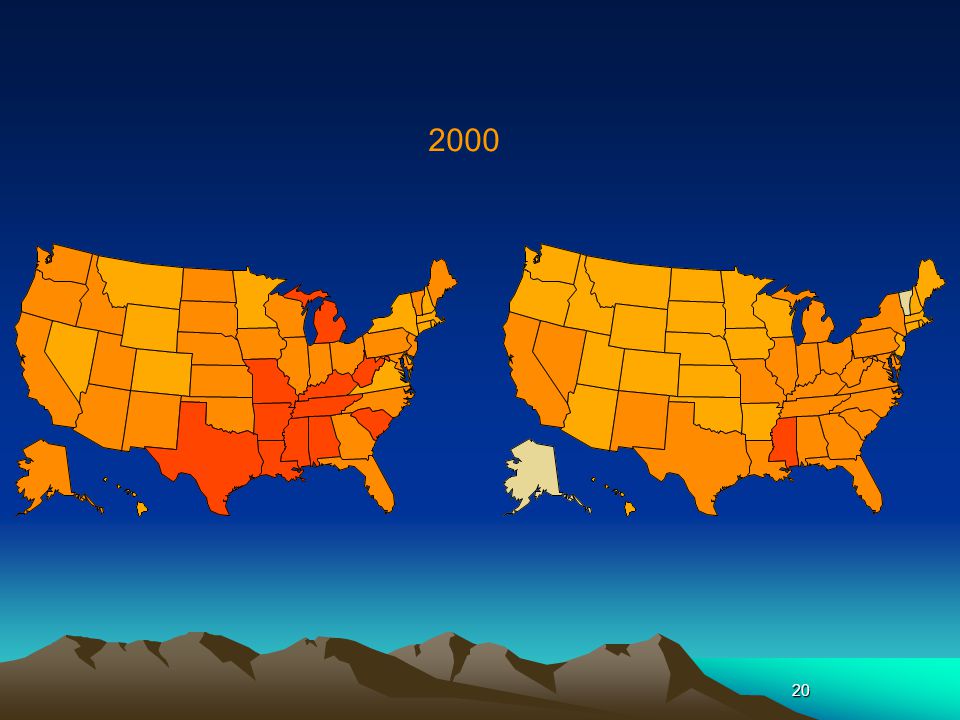
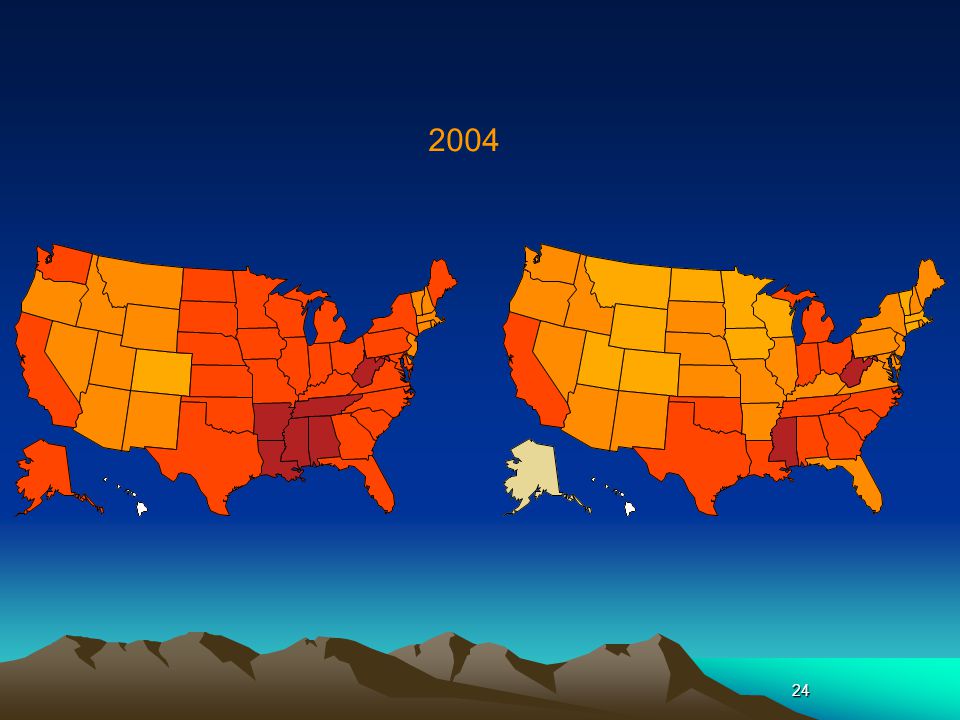
Age-adjusted Percentage of U.S. Adults Who Were Obese or Who Had Diagnosed Diabetes Obesity (BMI ≥30 kg/m2) 1994 2000 2007 No Data <14.0% % % % >26.0% Diabetes 1994 2000 2007 No Data <4.5% % % % >9.0% CDC’s Division of Diabetes Translation. National Diabetes Surveillance System available at 13
 No Data <14.0% % % % >26.0% Diabetes No Data <4.5% % % % >9.0% CDC’s Division of Diabetes Translation. National Diabetes Surveillance System available at")
14
1994 Methodology The percent of U.S. adults who are obese or who have diagnosed diabetes was determined by using data from the Behavioral Risk Factor Surveillance System (BRFSS, available at An ongoing, yearly, state-based telephone survey of the non-institutionalized adult population in each state, the BRFSS provides state-specific information on behavioral risk factors for disease and on preventive health practices. Respondents who reported that a physician told them they had diabetes (other than during pregnancy) were considered to have diagnosed diabetes. Self reported weight and height were used to calculate body mass index (BMI): weight in kilograms divided by the square of height in meters. A BMI greater than or equal to 30 was considered to be obese. Rates were age-adjusted using the 2000 U.S. Standard Population. 14
 were considered to have diagnosed diabetes. Self reported weight and height were used to calculate body mass index (BMI): weight in kilograms divided by the square of height in meters. A BMI greater than or equal to 30 was considered to be obese. Rates were age-adjusted using the 2000 U.S. Standard Population. 14.")
15
1995 15

16
1996 16

17
1997 17

18
1998 18

19
1999 19
20
2000 20
21
2001 21

22
2002 22

23
2003 23

24
2004 24
25
2005 25

26
2006 26

27
2007 27

28
Childhood Diabetes Rising T2DM, parallel with obesity
10-14% of new paediatric DM ~ 50% in rural and remote Many likely undiagnosed Indigenous children disproportionately represented > ½ of children with T2DM are indigenous Mx – Diet, exercise, Metformin and Insulin 28

29
Gestational diabetes Temporary
Occurs in pregnancy and usually disappears after delivery Mother has much greater risk of developing diabetes later Morbidity Gestational diabetes occurs during pregnancy in about 3–8% of females not previously diagnosed with diabetes. Screening tests for gestational diabetes are usually performed around the 24th–28th week of pregnancy. It is a temporary form of diabetes and usually disappears after the baby is born. However, it is a marker of much greater risk of developing Type 2 diabetes later in life. 29

30
Metabolic Syndrome “Syndrome X”
Associated with increased risk of CVD, CKD and death. DIAGNOSIS Insulin resistance FBG > 5.6 or T2DM Central Obesity WC > 94cm Abnormal lipid profile: HDL Male < 1.03, Female < 1.29 Hypertension Sys > 130, dias >85 30

31
Julia Marley’s study 31

32
32

33
33

34
Treatment Options 34

35
Treatment Options ↓Glucose load: ↓ meal size & sugars
↑Insulin release (“secretogogues”) sulphonourea eg Gliclazide Insulin, Pancreas Tx ↓Insulin resistance (“insulin sensitizers”) Exercise & weight loss Metformin or glitazones 35
 sulphonourea eg Gliclazide. Insulin, Pancreas Tx. ↓Insulin resistance ( insulin sensitizers ) Exercise & weight loss Metformin or glitazones. 35.")
36
Diabetes management Life-style Oral Medications Insulin
physical activity Weight ↓ Smoking cessation Alcohol reduction Low fat diet Oral Medications Increase insulin production (sulphonoureas) Increase insulin sensitivity (metformin) Insulin 36
 Increase insulin sensitivity (metformin) Insulin. 36.")
37
Short-acting & Long-acting Insulin
Breakfast Lunch Dinner Short acting Plasma insulin Glargine 4:00 8:00 12:00 16:00 20:00 24:00 4:00 8:00 Time 37

38
Aims in Mx (KAMSC Chronic Disease Protocol)
HbA1C < 7% Total cholesterol < 4 mmol/L HDL > 1mmol/L, TG < 2, LDL < 1.8 BP < 125/80 BMI 17-25 WC < 100 cm NO smoking Alcohol – max 2 std drinks/day Exercise > 20 mins > 4 day/wk ACR < 3.5 mg/mmol 38

39
Multidisciplinary Team Care
Diabetes: Endocrinology/Dietetics Microvascular Disease: Ophthalmology/Nephrology/Podiatry Macrovascular Disease: Vascular Surgery/Cardiology 39

40
Specialised Treatments
Insulin Pump Tight BSL control for brittle diabetes Awaiting autofeedback sensors Pancreas Transplantation Insulin independence Operative mortality 40

41
Diabetic Complications
41

42
Diabetic Complications
Microvascular Retinopathy Nephropathy Neuropathy peripheral & autonomic Macrovascular Cerebrovascular Cardiovascular Peripheral vascular 42

43
43

44
Natural History of Type I
5 stages 1. Hyperfiltration at diagnosis (low s. creat) 2. Microalbuminuria > 5-10 years (urine ACR) 3. Overt proteinuria with ↑BP & retinopathy for 2-5 years, minimal haematuria (MSU) 4. CKD with normal-sized kidneys (renal U/S) 5. ESKD months after CKD 44
 2. Microalbuminuria > 5-10 years (urine ACR) 3. Overt proteinuria with ↑BP & retinopathy for 2-5 years, minimal haematuria (MSU) 4. CKD with normal-sized kidneys (renal U/S) 5. ESKD months after CKD. 44.")
45
Stage Diabetes Duration Manifestations 1 0 – 3-5 Renal hypertrophy
GFR 2 3-5 + Basement M thickening Mesangial expansion 3 7-15 + Microalbuminuria HPT 4 Proteinuria ↓ GFR 5 15 – 25+ ESKD 45

46
Natural History of Type II
Far commoner than Type I Long asymptomatic phase HPT, nephropathy & retinopathy often present at time of Dx Degree of proteinuria correlates with general vascular risk and 20x CKD risk 46

47
Hyperfiltration Phase
Elevated GFR 2o ↑BSL/BP/protein/obesity ↑Intra-glomerular pressure “Too good to be true” serum creatinine Accelerated progression to CKD 47

48
Albuminuria then Proteinuria
Microalbuminuria first (lower MW) Raised by ↑GFR (i.e. ↑BSL, ↑protein diet, fever, exercise) Spot urine ACR or PCR more convenient than 24hr collection more accurate than urinalysis adjusts for fluid intake underestimates the muscular patient 48
 Raised by ↑GFR (i.e. ↑BSL, ↑protein diet, fever, exercise) Spot urine ACR or PCR. more convenient than 24hr collection. more accurate than urinalysis. adjusts for fluid intake. underestimates the muscular patient. 48.")
49
Diabetic Nephropathy From haemodynamic & metabolic stresses
deposition of advanced glycosylation end products in connective tissue & sml vessels. May take yrs but many T2DM asymptomatic for several yrs, hence nephropathy may already be present at Dx 49

50
1st clinical sign is microalbuminuria (ACR)
Kidney not able to catabolise albumin This can also occur transiently with Fever Exercise Short term hyperglycaemia High protein meal Hence, repeat at a later date/rule out reversible DM + HPT, x 20 risk of progressive nephropathy DM + HPT + poor diabetic & lipid control, x 40 risk 50

51
Nephropathy Risk Factors
DM Type & Duration 20% of Type I after 20 years 40% of Type II any duration Poor diabetic control Hypertension Aboriginal > Indian > Caucasian Smokers Family history 51

52
Nephropathy Risk Factors
Modifiable HbA1c, BP & total cholesterol (Odds Ratio 43) Obesity, smoking Non-modifiable Age, ethnicity, male sex 52
 Obesity, smoking. Non-modifiable. Age, ethnicity, male sex. 52.")
53
Delaying Complications
Tight diabetic control Prevention of microvascular Cmplx Risk of hypos Tight BP control Prevention and management of micro & macro Cmplx Use ACEI, ARB’s or both combined 53

54
ACE Inhibitors can prevent progression of renal failure
Normotensive Type 2 Diabetics 400 110 Proteinuria (mg/day) % Initial GFR 350 105 320 Placebo 100 280 Enalapril 240 95 200 90 160 Placebo Enalapril 85 120 80 80 1 2 3 4 5 6 1 2 3 4 5 6 Years Years Ann Intern Med 54
 % Initial GFR Placebo Enalapril Placebo. Enalapril Years. Years. Ann Intern Med")
55
ACEI/ARB Proteinuria Remission
Protein/Creat Ratio - Urine 1000 mg/mmol 500 H 2000 2001 2002 Jan 2000 Creatinine - Plasma H H 90 80 70 umol/L 60 50 L L 40 30 2000 2001 2002 Jan 2000 55

56
Use of ACEi/ARBs BUT: ARF risk if underperfused
Hyperkalaemia risk with many types of pills (spironolactone) SO: Check BP & electrolytes at 1/12 and 6/12 Check all new pills 56
 SO: Check BP & electrolytes at 1/12 and 6/12. Check all new pills. 56.")
57
Q. Which features are typical of diabetic CKD at presentation ?
Haematuria Small scarred kidneys Progress to ESKD in <2yrs Associated retinopathy β-blockers better than ACE-I Rx 57

58
Q. Which features are typical of diabetic CKD at presentation ?
Haematuria NO Small scarred kidneys NO Progress to ESKD in <2yrs NO Associated retinopathy YES β-blockers better than ACE-I Rx NO 58

59
Diabetes and ESKD Reducing insulin requirements
Difficult vascular access Accelerated macrovascular disease Advanced microvascular disease Frequent sepsis Silent ischaemia 2-3 x death rate vs non-DM patients 59

60
How can DM effect Dialysis?
Autonomic neuropathy – may suffer hypotension increased by large fluid shift in HD Uncontrolled BSLs – may absorb some glucose in PD fluid Severe PVD – difficult to get vascular access for HD PVD may also affect peritoneum and reduce PD success Increased risk of infections – problem in both Transplants – new kidneys develop nephropathy, hence good glycaemic control important 60

61
Strict BSL Control in early Type I
Target HbA1c < 7% For every 1%↓ HbA1c: 10% ↓CVD 40% ↓Microvascular Cmplx BUT: Doubles risk of hypoglycaemia Loss of control with DM duration: 50% at 3yr 30% at 6yr 15-25% at 9yr (= % patients with HbA1c < 7% on Met or OHA alone) 61
 61.")
62
Strict BSL Control in DM CKD
AND: Minimal benefit if overt proteinuria Diabetes “cured” by advancing CKD reduced appetite and CHO intake prolonged insulin half-life false elevation of HbA1c by 0.5-1% 62

63
Metformin in CKD No hypos or weight gain Inexpensive BUT:
Renally-excreted Excess doses → anorexia, diarrhoea Dose adjust to GFR: 2g to 250mg/day Protocol says eGFR 30 – 59 max 1gm/day cease when eGFR <30 but… Risk of fatal lactic acidosis if unwell 63

64
Glitazones in DM Av.1% fall in HbA1c as monoRx or add-on
Preserves beta-cell fn - use early Durable effect >3yrs BUT: 1-2/12 delayed onset Average 4kg SC fat gain, visceral fat loss Oedema (Na+/H20, ↑vasc. permeability) Expensive 64
 Expensive. 64.")
65
Strict BP Control at any stage
½’s (or even stops) rate of fall in GFR Greater benefit than tight BSL control Falling BP Target = 120/70 currently Preferential use of ACEi/ARBs Complete regression of proteinuria possible Helps all micro- & macrovascular disease (Parving, UKPDS, Captopril Trial, MicroHOPE, IRMA/IDNT, JNC VI) 65
 rate of fall in GFR. Greater benefit than tight BSL control. Falling BP Target = 120/70 currently. Preferential use of ACEi/ARBs. Complete regression of proteinuria possible. Helps all micro- & macrovascular disease. (Parving, UKPDS, Captopril Trial, MicroHOPE, IRMA/IDNT, JNC VI) 65.")
66
Use of ACEi/ARBs: actions
Antihypertensive ↓ by salt excess, ↑by thiazides need mean of 3 agents in mild CKD Antiproteinuric 30-50%↓ alone, 40-70%↓ together Renoprotective corrects ↑GFR, expected 30% ↑creatinine 66

67
Combination ACEI/ARBs ↓ proteinuria by 90%
Laverman Kidney Int 2002 67

68
ACEI/ARB Proteinuria Remission
Protein/Creat Ratio - Urine 1000 mg/mmol 500 H 2000 2001 2002 Jan 2000 Creatinine - Plasma H H 90 80 70 umol/L 60 50 L L 40 30 2000 2001 2002 Jan 2000 68

69
Use of ACEi/ARBs: risks
BUT: ON-TARGET – CVD & death if no proteinuria Risk of ARF Esp. if dry, in CCF, bilateral RAS, on NSAIDs Risk of hyperkalaemia in diabetic CKD Esp. if high fruit/nut/choc diet, acidotic Esp. if other K+-sparing Rx (NSAIDs, spironolactone, trimethoprim) 69
 69.")
70
Use of ACEi/ARBs: guidelines
SO: Always check BP & electrolytes 1 month after starting or adding thiazide Check after 1 week in high-risk patients Stop temporarily if unwell 70

71
Thank You Questions ? 71

72
References Mark Thomas. Nephrologist. Royal Perth Hospital.
Kidney Diseases, 5th Edition. National Kidney Foundation. 2009 Couzos and Murray. Aboriginal Primary Health Care, an evidence based approach. 3rd edition. 2008 Murtagh. Murtagh’s General Practice. 4th edition. 2007 72

Similar presentations


