Download presentation
Presentation is loading. Please wait.

1
ASSESSING SHALE GAS RESOURCE PLAYS

2
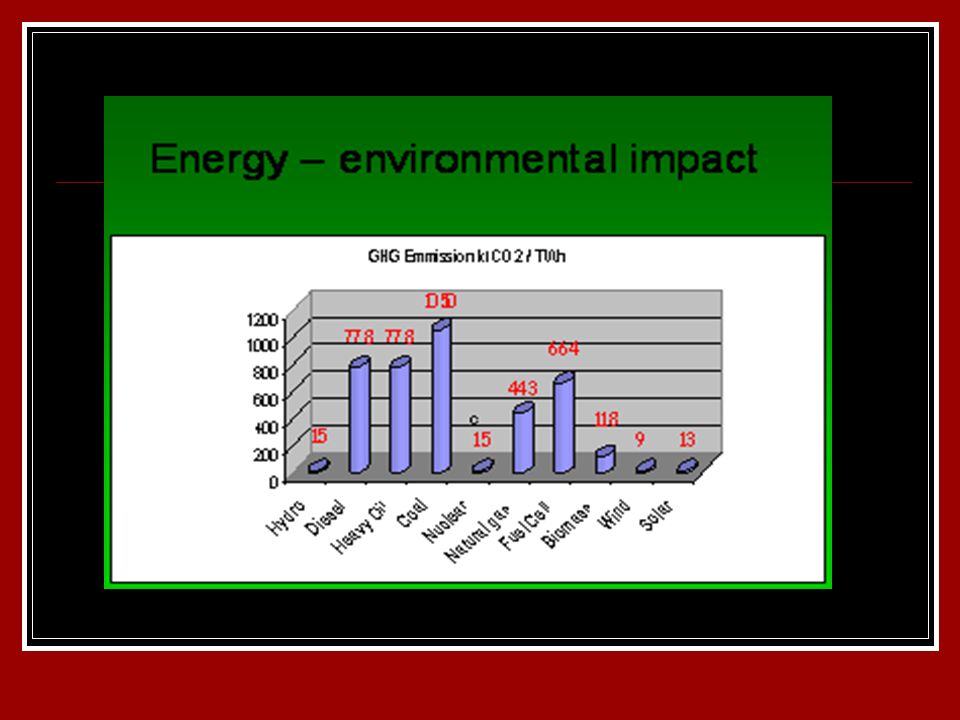
Energy Experts Believe Oil is Finite Demand is not

3
E&P Business: Oil Price, Margin, Size & Value high tide = high operating costs low tide = low operating costs High Margin Asset *Low Margin Asset Low Oil Price High Oil Price

6
Global Shale Gas Volumes Source: Rogner 1997 GIP TCF 32,500 Over 32,500 TCF of gas identified worldwide from Unconventional Reservoirs Despite Early Stages of Exploration Huge Amounts of Shale Gas is estimated in different parts of world

7
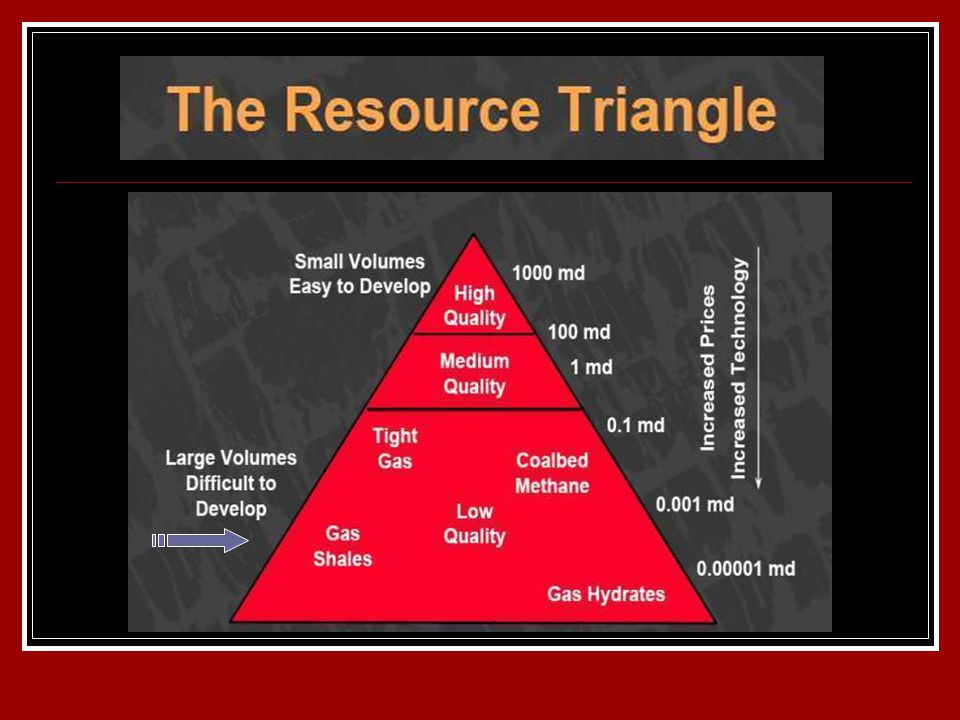
HC Related Non conventional Resources Oil resources Oil ShalesTar sandsHeavy oil Gas resources Clastic/carbonates Reservoirs Tight Gas Basin Centered Gas Shale/coal Reservoirs Shale Gas Coal Bed methane LBM/CMM Ravi Misra

8
Basin Centered gas Tight Gas Shale Gas

9
Attractive, Hottest Business Opportunity Across Globe Shale Gas is key to USA Energy Basket US 2008 ytd. production of Shale Gas is 3.23 TCF 17% of total US gas production from Shale Gas India’s total annual Conventional Gas production is only 26% of US Shale Gas production (Schlumberger)
.")
10
Shale Gas

11
What is shale Gas? Shale gas is natural gas contained within shale sequences. The gas is stored in shale in two major ways: As adsorbed gas on kerogen (insoluble organic matter). In this respect, it is similar to natural gas from coals. The adsorbed gas portion range between 20% (Barnett Shale) and 85% (Lewis Shale). UTICA SHALES, NEW YORK Continuous type regionally pervasive self contained natural gas plays in Shale/Shaly Formations in Shale/Shaly Formations
. In this respect, it is similar to natural gas from coals. The adsorbed gas portion range between 20% (Barnett Shale) and 85% (Lewis Shale). UTICA SHALES, NEW YORK Continuous type regionally pervasive self contained natural gas plays in Shale/Shaly Formations in Shale/Shaly Formations.")
12
Play Type Identification is Critical For Assessment and Exploration Thermogenic BiogenicMix Type

13
Gas Shales contain significant portions of both adsorbed gas and interstitial pore gas …..Contd.

14
NO TWO SHALES ARE ALIKE But look for right combination of shale characteristics SHALE TYPING IS ESSENTIAL

15
PLAY CHARACTERISTICS Continuous type plays Cover large arial extent Large net thickness (on average) Traits which differ from coals
 Traits which differ from coals")
17
*Gas Saturations Adsorbed and Free Gas* PRINCIPAL TYPES OF GAS STORAGE PHENOMENA

18
Natural Fracture Systems often Control the Success or Failure of Stimulation Attempts Natural Fracture Geometry can Change Laterally and Vertically with Lithology related Mechanical Properties and Stress Changes Dual Permeability System

19
The Flow Path

20
SHALE PLAY EVALUATION

21
Generation Potential (source) Storage Potential (reservoir) Production Potential (Productivity) The Fundamental Aspects for Evaluation
 Storage Potential (reservoir) Production Potential (Productivity) The Fundamental Aspects for Evaluation")
22
EVALUATION CRITERIA TECHNOLOGICAL Gas assessment related Drilling and completion related Stimulation and production related COMMERCIAL & ECONOMIC GEOSCIENTIFIC Geological Geochemical Petrophysical Reservoir

23
Geological Parameters Shale Thickness (>100M) Shale Depth (<2500M) Areal extent Shale Type (silty) Shale brittleness (low Poissons ratio & high Youngs Modulus)
 Shale Depth (<2500M) Areal extent Shale Type (silty) Shale brittleness (low Poissons ratio & high Youngs Modulus)")
26
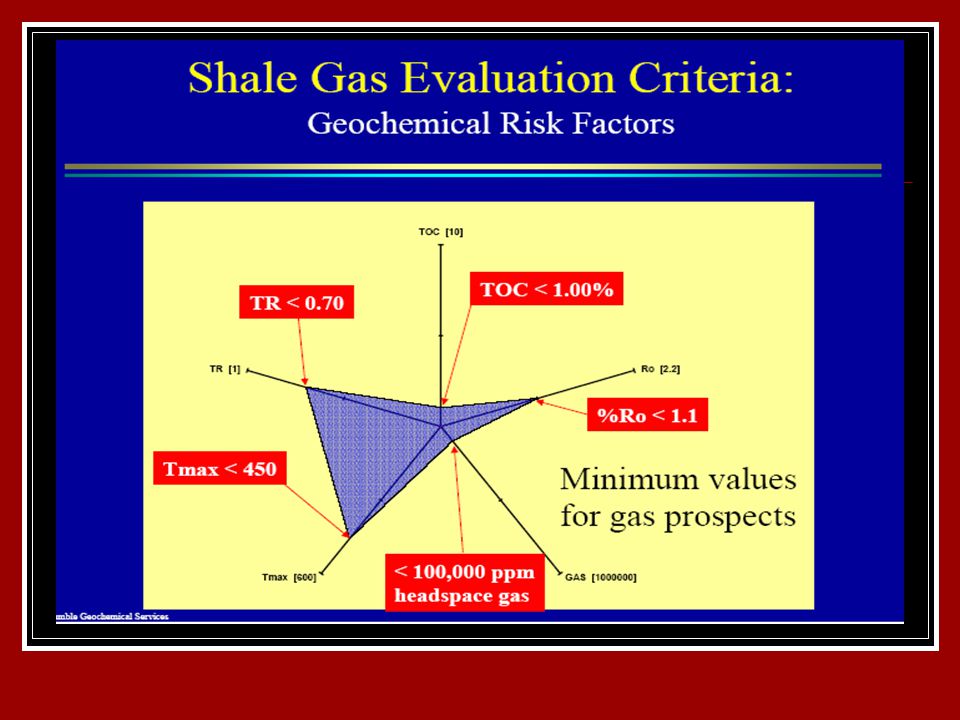
GEOCHEMICAL EVALUATION

27
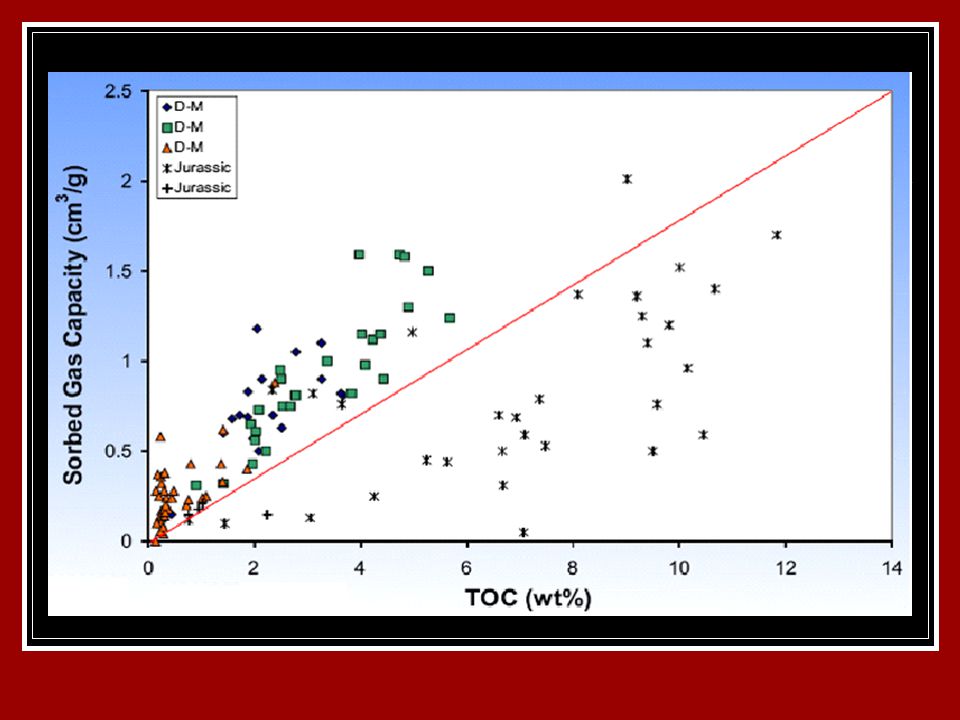
What makes the shale a good SOURCE for gas plays TO C Vro TR Thickness Kerogen type HI/O2 Biogenic-Thermogenic ratio

35
Multiple Methane Adsorption Isotherms, Antrim Shale Well

36
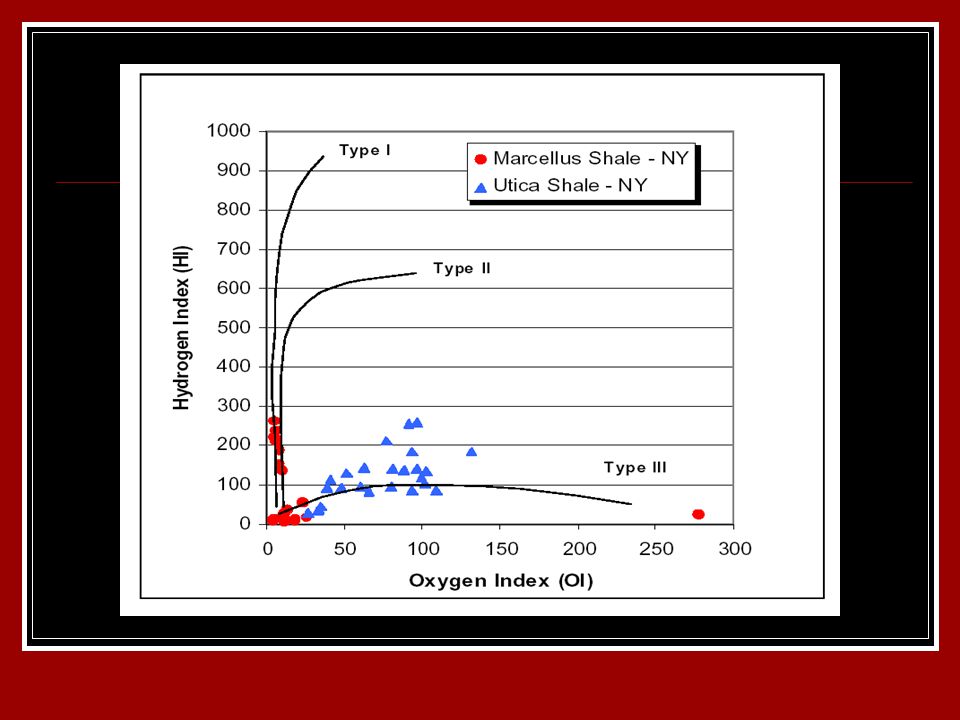
Organic Matter Type Effect Sapropelic Kerogens generate twice the volume of gas as do Humic Kerogens but oil interfere with release of gas until >1.0Vro Humic Kerogens (III) generates mainly gas starting at 0.5 Vro Type I Kerogen starts gas generation at higher maturity than type II and Type III Kerogens
 generates mainly gas starting at 0.5 Vro Type I Kerogen starts gas generation at higher maturity than type II and Type III Kerogens")
39
Iso Tmax plot

40
Iso Maturity Map

43
Martini 2003

44
Shale Gas Composition

46
Petrophysical

49
Log Motifs of producing Marcellus gas shales

51
Reservoir Characteristics

52
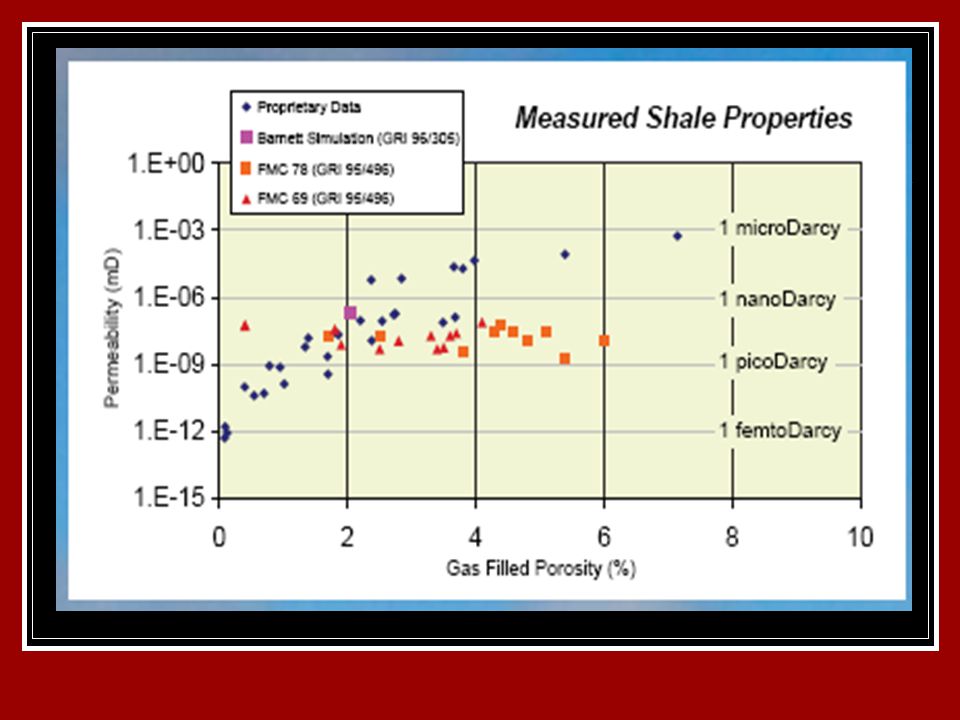
Type of shale- composition variability Clay volume,type Microporosity Permeability Fracture density, orientation, connectivity Diagenetic effects (fracture fillings) Geomechanical properties Stress elements Reservoir pressures and Temperature Adsorbed gas Free gas 15-85% 85-15%
 Geomechanical properties Stress elements Reservoir pressures and Temperature Adsorbed gas Free gas 15-85% 85-15%")
53
Composite Reservoir Property Evaluation

57
Well Pressures

62
Reservoir characterization in Barnet Shale

63
ASSESSING PRODUCTION POTENTIAL

64
High resolution heterogeneity is measured via continuous scratching along the length of the core Results provide a profile of unconfined strength and its variability along the length of the core Shale Reservoir Heterogeneity Measurement

65
RESERVOIR ANISOTROPY The implication of anisotropy is that material properties are different in the vertical direction (perpendicular to bedding) and horizontal direction (parallel to bedding), and that properties vary strongly with orientation to bedding. Anisotropic properties can be obtained via laboratory testing (core scale) and 3D seismic (reservoir scale ) Reservoir Anisotropy
 and 3D seismic (reservoir scale ) Reservoir Anisotropy.")
66
1 cm CalciteCalcite Humble No. 43 Yarborough & Allen, Ward County, Texas, Section 66, E. J. Brady Survey Humble No. 43 Yarborough & Allen, Ward County, Texas, Section 66, E. J. Brady Survey Comer (1991) location C2, sample C2-5 Humble No. 43 Yarborough & Allen, Ward County, Texas, Section 66, E. J. Brady Survey Humble No. 43 Yarborough & Allen, Ward County, Texas, Section 66, E. J. Brady Survey Comer (1991) location C2, sample C2-5 0.2 mm Fractured Woodford, Permian Basin 10.1 % TOC 0.55 % R o Type II Kerogen 10.1 % TOC 0.55 % R o Type II Kerogen 7175 ft
 location C2, sample C2-5 Humble No. 43 Yarborough & Allen, Ward County, Texas, Section 66, E. J. Brady Survey Humble No. 43 Yarborough & Allen, Ward County, Texas, Section 66, E. J. Brady Survey Comer (1991) location C2, sample C mm Fractured Woodford, Permian Basin 10.1 % TOC 0.55 % R o Type II Kerogen 10.1 % TOC 0.55 % R o Type II Kerogen 7175 ft.")
69
TECHNOLOGICAL & ENGINEERING ISSUES

70
DRILLING COMPLETION STIMULATION FRACTURING PROPPANTS

71
Pinnate Drilling Pattern After, Doug Wight, NAPE 2005

72
Fishbone Drilling Pattern

73
A Standard Shale Gas Well Construction

74
Typical Completions Vertical wells Horizontal wells Surface Woodford Lower Barnett Upper Barnett Surface Barnett Minimum horizontal stress Vertical Stress Maximum horizontal stress

75
A Multistage Completion Design

76
Completion Objectives Create complex fractures that will feed a main fracture connected to the wellbore Minimize the near wellbore tortuosity to reduce chance for screen-out Create a conductive path to allow flow of stimulation fluids as well as reservoir fluids Main Fracture Branch Fractures

77
Fracture orientation & well placement

78
Well Spacing in Different Shale Plays

79
Fluid Compatibility w/ Shales Some shales sensitive to fresh water and/or extreme pH environments Lab testing recommended for fluid compatibilities CST tests can be performed quickly Shale pack test provide more data but more time intensive Sensitivity of clay control additives with a shale core sample ** Compatibility Testing is a Critical Step**

80
Fractures in Shale

81
Initial Shale Stimulations Large volume of water(80,000barrels) Small volume of propping agent High pump rate with low proppant concentrations Attempt to stimulate multiple perf clusters at one time
 Small volume of propping agent High pump rate with low proppant concentrations Attempt to stimulate multiple perf clusters at one time")
82
Other Considerations High viscous gels may create bi-winged fractures High initial pressure may be due to damage near wellbore Cement / mud in fractures Small volume of acid can help overcome damage Microsiesmic helps in monitoring the stimulation pattern Shale Well

83
Shale Types & Fracture Types

84
Improvement in Shale Reservoir Characteristics after Treatment

85
Increasing Frequency of Frac Jobs

86
Selecting Prop pants Embedimentscrushing

88
Monitoring Stimulation Job Effectivity

89
A typical Hydrofrac Operation For Shale Gas Stimulation Job

91
Type of well & completion impacts on production

92
Shale Gas Resource Estimation

93
MAKING UNCONVENTIONAL GAS RESOURCE ESTIMATES IS DIFFICULT Does not lend itself to finding-rate models Does not follow rules of field size distribution or discovery process models Requires prudent incorporation of “technology progress” for drilling efficiencies, well costs and reserves per well Requires considerable data, acceptance of geologic variability, and numerous “expert judgment” calls. Assessing the size and quality of unconventional gas is a challenge:

94
WHY UNCONVENTIONAL GAS RESOURCE ESTIMATES DIFFER! Given their “continuous” nature, the size of an unconventional gas play (recoverable resource) is determined by: (1) play area; (2) well spacing; (3) well performance; and, (4) expectations for success. The Williams Fork (Mesaverde) tight gas play illustrates how moderate differences in assumptions can lead to widely different estimates. U.S. Geologic Survey (2003) Advanced Resources S. Basin Only (2004) ASSUMPTIONS Play Area (mi 2 ) 1,9891,008 Developed (%) 3%4% Well Spacing (acres/well) 7320 EUR/Well (Bcf) 0.911.21 Success/Availability Factors (%) 20%83% RESULTS Recoverable Resource (Tcf) 3.131.3
 is determined by: (1) play area; (2) well spacing; (3) well performance; and, (4) expectations for success. The Williams Fork (Mesaverde) tight gas play illustrates how moderate differences in assumptions can lead to widely different estimates. U.S. Geologic Survey (2003) Advanced Resources S. Basin Only (2004) ASSUMPTIONS Play Area (mi 2 ) 1,9891,008 Developed (%) 3%4% Well Spacing (acres/well) 7320 EUR/Well (Bcf) Success/Availability Factors (%) 20%83% RESULTS Recoverable Resource (Tcf)")
95
SHALE GAS PLAY ECONOMICS

96
BARNETTOHIOANTRIUM NEW ALBANYLEWIS Depth meter1980-2590610-1524182-670152-610 915- 1828 Well cost (Rs. Crores)2-2.70.9-1.350.81-1.12 0.56- 0.67 1.12- 1.35 Completion costs, (Rs. crores)0.45-0.670.11-0.22 0.11 0.45- 1.35 Well + completion cost (Rs.crores)2.45-3.370.2-1.570.92-1.34 0.67- 0.78 1.57- 2.70 Well spacing, Acres80-16040-160 8080-320 ECONOMICS OF DIFFERENT SHALE PLAYS IN USA
 Completion costs, (Rs. crores) Well + completion cost (Rs.crores) Well spacing, Acres ECONOMICS OF DIFFERENT SHALE PLAYS IN USA.")
97
Cost profiles for shale plays: (Barnett, Fayetteville and Woodford) Expected natural gas prices to average about $7 per MMBtu in 2007. The major shale plays show robust economics at a lower price, $6 per MMBtu. Base CaseDownside case $6/MM Btu Henry hub $4.5/MM Btu Henry hub Barnett core131%57% Barnett core59%8% Barnett core32%-105 Fayetteville51%7% Woodford61%135

98
REFERENCES Fayetteville Gas shale evolution, Richard F.Lane,2006 Fractured shale gas potential in New York, David G. Hill, Tracy E. Lombardi,& Jon P. Martin (2004) Custom technology makes shale resource profitable. Glenda Wylie, Ron Hyden, Von Parkey, Bill Grieser, Rick Middaugh, Trends in unconventional gas, Oil & Gas Journal, 2007 Unconventional gas, topic #29,National petroleum council, Stephen Holditch et al, 2007 Shale gas-Focus on Marcellus Shales, 2008. Lisa Sumy, for the oil & gas accountability project, Earthworks Dan Jarvie,Humble geochemical studies
 Custom technology makes shale resource profitable. Glenda Wylie, Ron Hyden, Von Parkey, Bill Grieser, Rick Middaugh, Trends in unconventional gas, Oil & Gas Journal, 2007 Unconventional gas, topic #29,National petroleum council, Stephen Holditch et al, 2007 Shale gas-Focus on Marcellus Shales, Lisa Sumy, for the oil & gas accountability project, Earthworks Dan Jarvie,Humble geochemical studies.")
99
ACKNOWLEDGEMENT Author is indebted to Sh D. K. Pande, Director (Expl) ONGC & ONGC Management for permission and support Author acknowledges and thanks various Cos. engaged in shale gas E&P business and providing the necessary data in public domain which made it possible to comprehend and effectively communicate to the distinguished audience which will go a long way in popularizing shale gas in India.
 ONGC & ONGC Management for permission and support Author acknowledges and thanks various Cos. engaged in shale gas E&P business and providing the necessary data in public domain which made it possible to comprehend and effectively communicate to the distinguished audience which will go a long way in popularizing shale gas in India..")
100
THANKS

Similar presentations


 Permeability Testing WTN Network Meeting April 28 - 29, 2011 ExxonMobil Exploration / Well Testing Team.>")


