Download presentation
Presentation is loading. Please wait.

1
Taking the Leap - Using ODS Statistical Graphics for Data Visualization Wei Cheng, Isis Pharmaceuticals, Inc.

2
Those who can tune that engine well — who solve basic human problems with greater speed and simplicity than those who came before — will profit immensely. Evan Williams, Founder of Blogger and Twitter

3
Life is a travelling to the edge of knowledge, then a leap taken -- D. H. Lawrence

4
Outline of Topics Create statistical graphs from SAS procedures Create statistical graphs from Statistical Graphics (SG) procedures Create statistical graphs from Graph Template Language (GTL) ODS Graphics Designer ODS Graphics Editor
 procedures Create statistical graphs from Graph Template Language (GTL) ODS Graphics Designer ODS Graphics Editor")
5
Outline of Topics Create statistical graphs from SAS procedures Create statistical graphs from Statistical Graphics (SG) procedures Create statistical graphs from Graph Template Language (GTL) ODS Graphics Designer ODS Graphics Editor
 procedures Create statistical graphs from Graph Template Language (GTL) ODS Graphics Designer ODS Graphics Editor")
6
Outline of Topics Create statistical graphs from SAS procedures Create statistical graphs from Statistical Graphics (SG) procedures Create statistical graphs from Graph Template Language (GTL) ODS Graphics Designer ODS Graphics Editor
 procedures Create statistical graphs from Graph Template Language (GTL) ODS Graphics Designer ODS Graphics Editor")
7
Outline of Topics Create statistical graphs from SAS procedures Create statistical graphs from Statistical Graphics (SG) procedures Create statistical graphs from Graph Template Language (GTL) ODS Graphics Designer ODS Graphics Editor
 procedures Create statistical graphs from Graph Template Language (GTL) ODS Graphics Designer ODS Graphics Editor")
8
Outline of Topics Create statistical graphs from SAS procedures Create statistical graphs from Statistical Graphics (SG) procedures Create statistical graphs from Graph Template Language (GTL) ODS Graphics Designer ODS Graphics Editor
 procedures Create statistical graphs from Graph Template Language (GTL) ODS Graphics Designer ODS Graphics Editor")
9
Procedure ODS Data & Template Data & Template Output Object ODS Output Destination Engine HTMLData SetRTFPDFDocument Styles Data Table Template Store Got Graph? No Statistical Graphics Engine Expressions Functions Yes or Graph

10
ODS Graphics Basics ods file = … Ods close; ods file = … Ods close;

11
ODS Graphics Basics ods file = … ods graphics on; Ods close; ods file = … ods graphics on; Ods close;

12
ODS Graphics Basics ods file = … ods graphics on; ods graphics off; Ods close; ods file = … ods graphics on; ods graphics off; Ods close;

13
ODS Graphics Basics ods file = … ods graphics on / ; ods graphics off; Ods close; ods file = … ods graphics on / ; ods graphics off; Ods close;

14
ODS Graphics Basics ods graphics on / ; Options: RESET IMAGENAME ANTIALIAS HEIGHT BORDERSCALE OUTPUTFMT WIDTH IMAGEMAP more-options ods graphics on / ; Options: RESET IMAGENAME ANTIALIAS HEIGHT BORDERSCALE OUTPUTFMT WIDTH IMAGEMAP more-options

15
Create Statistical Graphs from SAS Procedures ods file = … ods graphics on ; Proc freq data = sashelp.heart; tables bp_status; Run; ods graphics off; Ods close; ods file = … ods graphics on ; Proc freq data = sashelp.heart; tables bp_status; Run; ods graphics off; Ods close;

16
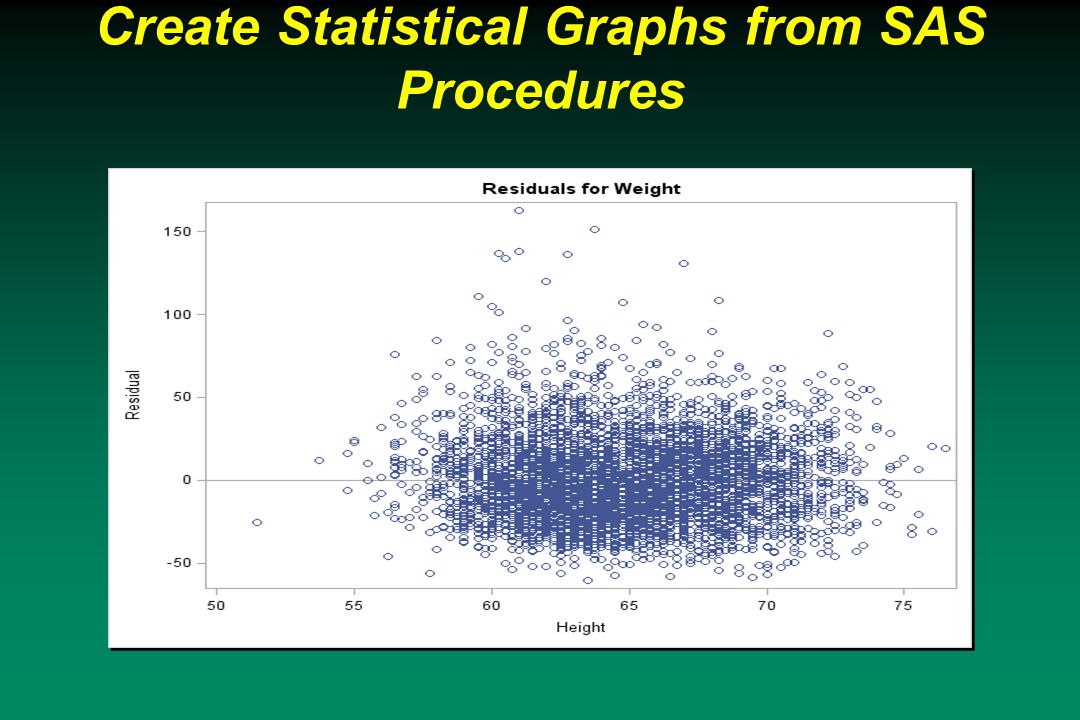
Create Statistical Graphs from SAS Procedures

18
ods graphics on ; Proc freq data = sashelp.heart; tables bp_status / plots(only)= freqplot; Run; ods graphics off; ods graphics on ; Proc freq data = sashelp.heart; tables bp_status / plots(only)= freqplot; Run; ods graphics off;
= freqplot; Run; ods graphics off; ods graphics on ; Proc freq data = sashelp.heart; tables bp_status / plots(only)= freqplot; Run; ods graphics off;")
19
Create Statistical Graphs from SAS Procedures ods graphics on ; Proc freq data = sashelp.heart; tables bp_status / plots(only)= freqplot (type = dot); Run; ods graphics off; ods graphics on ; Proc freq data = sashelp.heart; tables bp_status / plots(only)= freqplot (type = dot); Run; ods graphics off;
= freqplot (type = dot); Run; ods graphics off; ods graphics on ; Proc freq data = sashelp.heart; tables bp_status / plots(only)= freqplot (type = dot); Run; ods graphics off;")
20
Create Statistical Graphs from SAS Procedures

21
ods graphics on ; Proc freq data = sashelp.heart; tables bp_status / plots(only)= freqplot (type=dot orient = vertical); Run; ods graphics off; ods graphics on ; Proc freq data = sashelp.heart; tables bp_status / plots(only)= freqplot (type=dot orient = vertical); Run; ods graphics off;
= freqplot (type=dot orient = vertical); Run; ods graphics off; ods graphics on ; Proc freq data = sashelp.heart; tables bp_status / plots(only)= freqplot (type=dot orient = vertical); Run; ods graphics off;")
22
Create Statistical Graphs from SAS Procedures

23
ods graphics on ; Proc freq data = sashelp.heart; tables sex * bp_status / plots (only) = freqplot; Run; ods graphics off; ods graphics on ; Proc freq data = sashelp.heart; tables sex * bp_status / plots (only) = freqplot; Run; ods graphics off;
 = freqplot; Run; ods graphics off; ods graphics on ; Proc freq data = sashelp.heart; tables sex * bp_status / plots (only) = freqplot; Run; ods graphics off;")
24
Create Statistical Graphs from SAS Procedures

25
ods graphics on ; Proc freq data = sashelp.heart; tables sex * bp_status / plots (only) = freqplot (twoway = grouphorizontal); Run; ods graphics off; ods graphics on ; Proc freq data = sashelp.heart; tables sex * bp_status / plots (only) = freqplot (twoway = grouphorizontal); Run; ods graphics off;
 = freqplot (twoway = grouphorizontal); Run; ods graphics off; ods graphics on ; Proc freq data = sashelp.heart; tables sex * bp_status / plots (only) = freqplot (twoway = grouphorizontal); Run; ods graphics off;")
26
Create Statistical Graphs from SAS Procedures

27
ods graphics on ; Proc freq data = sashelp.heart; tables sex * bp_status / plots (only) = freqplot (twoway = stacked); Run; ods graphics off; ods graphics on ; Proc freq data = sashelp.heart; tables sex * bp_status / plots (only) = freqplot (twoway = stacked); Run; ods graphics off;
 = freqplot (twoway = stacked); Run; ods graphics off; ods graphics on ; Proc freq data = sashelp.heart; tables sex * bp_status / plots (only) = freqplot (twoway = stacked); Run; ods graphics off;")
28
Create Statistical Graphs from SAS Procedures

29
ods graphics on ; Proc freq data = sashelp.heart; tables bp_status / chisq plots(only)= deviationplot (type = dot); Run; ods graphics off; ods graphics on ; Proc freq data = sashelp.heart; tables bp_status / chisq plots(only)= deviationplot (type = dot); Run; ods graphics off;
= deviationplot (type = dot); Run; ods graphics off; ods graphics on ; Proc freq data = sashelp.heart; tables bp_status / chisq plots(only)= deviationplot (type = dot); Run; ods graphics off;")
30
Create Statistical Graphs from SAS Procedures

39
SAS/STAT (ANOVA, GLM, MIXED, LIFETEST, etc.) SAS/QC (CAPABILITY, SHEWHART, etc.) Base SAS (CORR, FREQ, UNIVARIATE) SAS/ETS (ARIMA, TIMESERIES, VARMAX, etc.) Other (HPF, HPFENGINE, SAS Risk Dimensions) Create Statistical Graphs from SAS Procedures
 SAS/QC (CAPABILITY, SHEWHART, etc.) Base SAS (CORR, FREQ, UNIVARIATE) SAS/ETS (ARIMA, TIMESERIES, VARMAX, etc.) Other (HPF, HPFENGINE, SAS Risk Dimensions) Create Statistical Graphs from SAS Procedures")
40
Create Statistical Graphs Using SG Procedures New SAS/GRAPH Procedures producing statistical graphs SGPLOT SGPANEL SGSCATTER

41
Create Statistical Graphs Using SG Procedures Proc sgplot data = sashelp.class; scatter x = height y = weight / group = sex name = “scatter”; loess x = height y = weight / group = sex clm clmtransparency = 0.6 nomarkers; keylegend “scatter” Run;

42
Create Statistical Graphs Using SG Procedures

43
Proc sgpanel data = sashelp.heart; panelby weight_status bp_status / layout = lattice; reg x = height y = weight / cli; Run;

44
Create Statistical Graphs Using SG Procedures

45
Proc sgscatter data = sashelp.heart; plot (diastolic systolic ) * (weight height) / group = weight_status; Run;
 * (weight height) / group = weight_status; Run;")
46
Create Statistical Graphs Using SG Procedures

47
Proc sgscatter data = sashelp.heart; compare x = (diastolic systolic ) y = weight; Run;
 y = weight; Run;")
48
Create Statistical Graphs Using SG Procedures

49
Animated Bubble Chart by Hans Rosling

50
Create Statistical Graphs Using GTL Proc template; define statgraph simplereg; beginggraph; entrytitle “Simple Scatter Plot with Regressin Line”; layout overlay; scatterplot x = height y = weight; regressionplot x = height y = weight; endlayout; endgraph; end; Run; Proc template; define statgraph simplereg; beginggraph; entrytitle “Simple Scatter Plot with Regressin Line”; layout overlay; scatterplot x = height y = weight; regressionplot x = height y = weight; endlayout; endgraph; end; Run;

51
Create Statistical Graphs Using GTL Proc sgrender data = sashelp.class template = simplereg; Run; Proc sgrender data = sashelp.class template = simplereg; Run;

52
Create Statistical Graphs Using GTL

53
Proc template; define statgraph myplot; beginggraph; entrytitle “Loess Fit by Gender”; layout overlay; scatterplot x = height y = weight / group = sex name = ‘sex’; loessplot x = height y = weight / group = sex name = ‘loess’;

54
Create Statistical Graphs Using GTL layout gridded / autoalign = (topleft); discretelegend ‘sex’ ‘loess’ / opaque = false border = true; endlayout; endgraph; End; Run;
; discretelegend ‘sex’ ‘loess’ / opaque = false border = true; endlayout; endgraph; End; Run;")
55
Create Statistical Graphs Using GTL

56
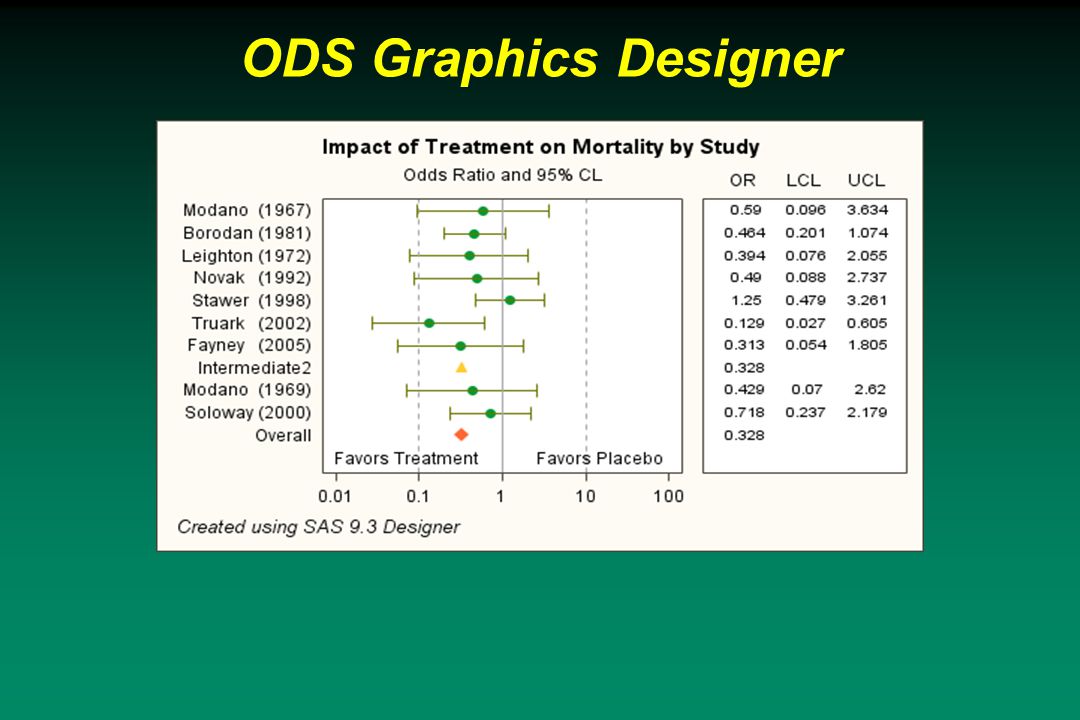
ODS Graphics Designer

61
ODS Graphics Editor

63
TaskWhat to Use? Graphs for statistical analysesStatistical procedures Stand-alone graphsSG Procedures Highly customized graphsGTL Enhancing graphs for presentationODS Graphics Editor Graphs without programmingODS Graphics Designer

64
Conclusion ODS Statistical Graphics is an exciting new functionality provided by SAS. It greatly enhances the ability of data visualization integrates the graphic display with the tabular output automates the production of statistical graphics maintains the ability to customize the displays by modifying the templates and styles create statistical graphs without knowledge of programming

65
Conclusion With SAS ODS Graphics, simpler and minimal coding is required to generate high quality statistical graphs. By spending less time in coding to improve the visual appearance of graphs for data visualization, we can focus more on the statistical analysis.

66
References SAS/STAT 12.3 User’s Guide Chapter 21 Statistical Graphics Using ODS SAS/STAT 12.3 User’s Guide Chapter 22 ODS Graphics Template Modification SAS/STAT 12.3 User’s Guide SAS User’s Guide for SG Procedures, Graph Template Language

68
About the Speaker Speaker: Location of company: Telephone: E-Mail: Wei Cheng Isis Pharmaceuticals, Inc. 2855 Gazelle Court Carlsbad, CA 92010 (760) 603-3807 wcheng@isisph.com
")
Similar presentations


 Runs SAS programs on the PC.>")

 but it was not widely available.>")


