Download presentation
Presentation is loading. Please wait.

1
Georgia Department of Education Division for Special Education Services Deborah Gay, Director

2
State Performance Plan/Annual Performance Report Indicator B-17 INDICATOR: The State’s SPP/APR includes a State Systemic Improvement Plan that meets the requirements set forth for this indicator. Basis for this plan is a detailed data and infrastructure analysis that will guide the development of the strategies to increase the State’s capacity to structure and lead meaningful change in LEAs.

3
State Identified Measurable Result(s) Coherent Improvement Strategies Theory of Action In-depth Data Analysis In-depth Infrastructure Analysis Phase I Components What is the problem? Broad Data Analysis Broad Infrastructure Analysis Why is it happening? What will we do about it?

4
SWD Enrollment Data Total SWD Enrollment Disability Categories Racial/Ethnic Groups Gender Performance Data Reading Performance and Gap Data Math Performance and Gap Data Performance by Disability Categories Least Restrictive Environment Graduation and Dropout Georgia ‘SIMRering’ SWD Discipline Data Racial/Ethnic Groups Gender Broad Data Analysis

5
Broad Infrastructure Analysis Numerous activities and initiatives that support college and career readiness. Not all activities and initiatives are aligned. ‘Opportunity gaps’ may be negatively impacting graduation rates. Rigorous standards are in place for all students. Georgia ‘SIMRering’

6
To address success gaps… … look closely at equity, inclusion, and opportunity for children in the affected groups Equity, Inclusion and Opportunity: Addressing Success Gaps

7
2014 Total Student Enrollment and Special Education Enrollment

9
* Inclusion Rate is for all students in disability category not specific to Meets/Exceeds Rate

10
Four Year Cohort Graduation Gap Four Year Cohort Graduation Rate School Year 2012- 13 School Year 2011- 12 School Year 2010- 11 All Students71.50%69.73%67.50% Students with Disabilities35.00%35.18%29.80% Gap36.50%34.55%37.70%

11
To address success gaps… Step One - Recognize the need for change in your school or district’s current practices and policies because you have identified a group of students who are experiencing success gaps. Step Two -Identify the root causes of the problem. Step Three - Make the changes that address those root causes. Equity, Inclusion and Opportunity: Addressing Success Gaps

12
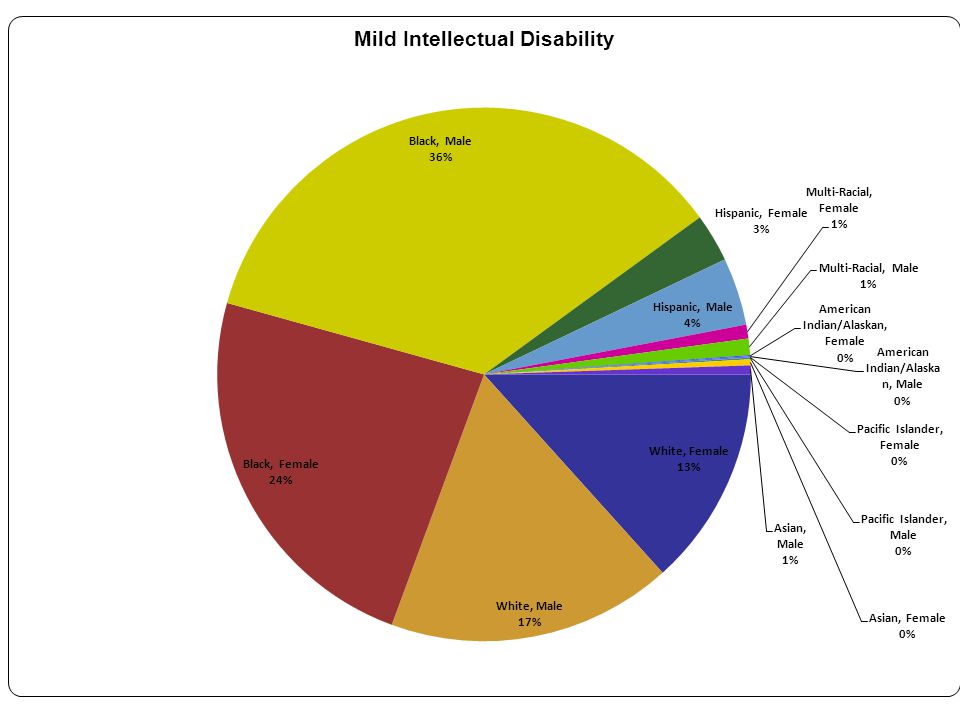
Cause Root Causes (EIO) Root Causes (EIO) Georgia’s Success Gaps 36.50% Graduation Gap MID Identification Rate for Black Students is Twice the Rate for White Students 8% to 14% Gap on CRCT Reading Identification Rate for Male Students is Twice the Rate for Female Students OSS >10 Days Exclusion Rate Is 4 Times Greater for Black SWD than White SWD 4.3% Gap More than 15 days absent 16% to 28% Gap on CRCT Math Data-based decision making Cultural responsiveness High-quality Core instructional program Universal screening and progress monitoring Evidence-based Interventions and supports
 Root Causes (EIO) Georgia’s Success Gaps 36.50% Graduation Gap MID Identification Rate for Black Students is Twice the Rate for White Students 8% to 14% Gap on CRCT Reading Identification Rate for Male Students is Twice the Rate for Female Students OSS >10 Days Exclusion Rate Is 4 Times Greater for Black SWD than White SWD 4.3% Gap More than 15 days absent 16% to 28% Gap on CRCT Math Data-based decision making Cultural responsiveness High-quality Core instructional program Universal screening and progress monitoring Evidence-based Interventions and supports")
13
How to address Success Gaps 1.Form a team- SEA, LEA and School (General Education and Special Education) 2.Study the data 3.Conduct a self-assessment 4.Provide evidence 5.Consider the students first 6.Ensure equitable participation 7.Develop a plan of action Equity, Inclusion and Opportunity: Addressing Success Gaps
 2.Study the data 3.Conduct a self-assessment 4.Provide evidence 5.Consider the students first 6.Ensure equitable participation 7.Develop a plan of action Equity, Inclusion and Opportunity: Addressing Success Gaps")
14
Georgia's Collaborative Communities Collaborative Communities for 2014-15 Focus: Results Driven Accountability Statement of Purpose: To explore the relationships between existing and available District and school level data and the student outcomes for those Districts and schools: using data to inform and improve practice.

15
Georgia's Collaborative Communities Collaborative Communities for 2014-15 Data Points for the ABC’s of Results Driven Accountability A Attendance Reporting Data BBehavior Data: Discipline events per student ratio. Comparison of District/school suspension data to state averages: consideration of discrepancy CCourse Completion/Subject Area Achievement High Schools: Course Completion Data Elementary and Middle Schools: Gaps between SWDs and general education scores on state tests for math and reading

16
Organizational Outline Conduct five structured collegial learning and sharing opportunities that encompass three identified areas in which current research literature supports causal connections between data and student achievement outcomes. The three topic areas are (A) Attendance, (B) Behavior/Discipline, and (C) Course Credit/Subject Area Achievement. The structure for collegial sharing will involve three general activities: 1)a brief review of current literature regarding the relationship between the topic area and student outcomes, 2)a discussion around where the most appropriate data about the topic can be located within each system, 3)an exercise in which each director reviews his/her own system data and shares conclusions, and 4)a discussion of what strategies and interventions are proving effective or hold promise and a sharing of ideas about possible new interventions.
 Attendance, (B) Behavior/Discipline, and (C) Course Credit/Subject Area Achievement. The structure for collegial sharing will involve three general activities: 1)a brief review of current literature regarding the relationship between the topic area and student outcomes, 2)a discussion around where the most appropriate data about the topic can be located within each system, 3)an exercise in which each director reviews his/her own system data and shares conclusions, and 4)a discussion of what strategies and interventions are proving effective or hold promise and a sharing of ideas about possible new interventions..")
17
Not So Easy “Equity, inclusion and opportunity for all students is an important goal, but one that is not easily achieved.” (EIO)
")
18
Equity, Inclusion and Opportunity : How to Address Success Gaps Indicators of Success Rubric IndicatorPlanningPartially implementedImplementedExemplary Data-based decision making Probing Questions: Does our school or district identify data elements or quality indicators that are tracked over time to measure school effectiveness? What are those data elements? Are the data valid and reliable? Are data disaggregated by student demographics such as race/ethnicity, gender, disability etc. to identify gaps in achievement and performance and trends with over- or under- representation in identification, placement and discipline? Are data reviewed at regular intervals to determine progress or change? Are data used to make policy, procedure and practice decisions in your school? How regularly do we use this data to inform our decisions? Decisions about the school curriculum, instructional programs, academic and behavioral supports, and school improvement initiatives are based on data Decisions about the school curriculum, instructional programs, academic and behavioral supports and school improvement initiatives are rarely based on systematic data. Some teachers and programs consistently use systematic valid and reliable data to inform decisions about curriculum, instructional programs, academic and behavioral supports, and school improvement initiatives. The data used is valid and reliable. A schoolwide formalized and systematic process is in place to monitor and reinforce the continuous improvement of individual learners, subgroups of learners, initiatives and programs within the school, and it is implemented by some but not all staff. The data used is valid and reliable. The schoolwide process for data based decision making is implemented and evident for all students and subgroups of students, in all classrooms, and is used in decisions about school initiatives or programs, as well. What is the evidence to support your rating? Equity, Inclusion and Opportunity: Addressing Success Gaps

19
The “what” and “how” are helpful! At the end of the day, what is the “WHY” behind the work? Dr. Zelphine Smith-Dixon, Assistant Director Division for Special Education Services and Supports Georgia Department of Education

Similar presentations
>")


