Download presentation
Presentation is loading. Please wait.

1
Continuous Improvement Data Review Workday High School Leadership Teams

2
Acknowledgements The material for this training day was developed by Ingham ISD: John Endahl, Melanie Kahler, Matt Phillips, Laura Colligan, Kelly Trout, Nate Stevenson and Mary Jo Wegenke Content based on the work of… MiBLSi project George Batsch, University of South Florida Robert Balfanz, Everyone Graduates Center and Johns Hopkins University Roland Good and Rob Horner, University of Oregon George Sugai, University of Connecticut Joe Torgesen, Florida Center for Reading Research Dawn Miller, Shawnee Mission School District, Kansas

3
Learning Targets Participants will be able to: Analyze process data and outcome data to identify academic and/or behavior areas in need of improvement Make connections between process and outcome data and its impact on student achievement Identify an academic and/or behavioral priority based upon the data analysis and use the Continuous Improvement Process to address the priority

4
Where to access materials for today: 1. POMPOMS! The documents we are using today are on flash drives attached to ISD pompoms. 2.MTSS Implementers Website http://mtss-implementers.wiki.inghamisd.org Building Data Review page OR Cute as they are, please don’t take home the pompoms! Materials you will need today Data Review Workbook(MTSS Wiki & hardcopy) Problem Solving Guide (MTSS Wiki & hardcopy) Worked Example Problem Solving Guide (MTSS Wiki & hardcopy) Log-in Information: Illuminate Ed, BAA, pbisapps.org, and SWIS Process Data: PETR/SWEPT, PET-M, BSA, BoQ, SAS
 Problem Solving Guide (MTSS Wiki & hardcopy) Worked Example Problem Solving Guide (MTSS Wiki & hardcopy) Log-in Information: Illuminate Ed, BAA, pbisapps.org, and SWIS Process Data: PETR/SWEPT, PET-M, BSA, BoQ, SAS.")
5
Agenda 9:00-9:15Welcome 9:15-11:45Team Time to work through the School Improvement Continuous Improvement Cycle 11:45- 12:00 District Check-in: Celebrations and Areas to Grow 12:00-1:00Lunch 1:00-3:15Continue Team Time 3:15-3:30District Check-in: Celebrations and Areas to Grow Session Evaluation

6
Remember… The Building Leadership Team does not have to solve every problem but does need to study building data to determine school-wide needs they will address along with identifying content area needs and ensuring the appropriate individual(s) who will address these needs are identified (e.g., which staff members are involved in implementing the action items to address the identified need(s)
 who will address these needs are identified (e.g., which staff members are involved in implementing the action items to address the identified need(s)")
7
Show me the Data… Illuminate Education Report On-Track Student List Report Attendance Explore - Mathematics & Reading Suspension Information 8 th Grade AIMSweb Universal Screening Data - Mathematics and Reading PBIS APPS District Assessments Process Data – BoQ, SAS, BSA, SWEPT, PET-M

8
Early Warning Signs

9
Early Warning Signs (EWS) o Routinely available data; available early in the school year o Better predictor than background characteristics o Cut points selected to balance yield and accuracy. o Helps target interventions o Informs of patterns and trends

10
Early Warning Signs (EWS) ATTENDANCE: Missing more than 10% of instructional time ◦First 20 Days of School: biggest risk factor for failing 9 th grade ◦Failing 9 th grade is one of most important factors influencing drop-out BEHAVIOR: Suspensions (ISS or OSS); Minor or Major ODRs ◦ISS or OSS: 6 hours of academic instruction lost per day ◦ODR: 20 minutes of academic instruction lost for student per referral COURSE PERFORMANCE: Course failures, grade point average; credit accrual ◦Combinations of academic indicators can reduce graduation likelihood to 55%
 ATTENDANCE: Missing more than 10% of instructional time ◦First 20 Days of School: biggest risk factor for failing 9 th grade ◦Failing 9 th grade is one of most important factors influencing drop-out BEHAVIOR: Suspensions (ISS or OSS); Minor or Major ODRs ◦ISS or OSS: 6 hours of academic instruction lost per day ◦ODR: 20 minutes of academic instruction lost for student per referral COURSE PERFORMANCE: Course failures, grade point average; credit accrual ◦Combinations of academic indicators can reduce graduation likelihood to 55%")
11
AttendanceBehaviorCoursework Grade 1 Overall attendance < 90% Absent 9 or more days from school per marking period. 2 or more minor or major ODRs 1 or more suspensions (ISS or OSS) Below grade level in reading or math Grade 3 Overall attendance < 90% Absent 3 or more times from school in first marking period. 2 or more minor or major ODRs 1 or more suspensions (ISS or OSS) Homework completion Needs Improvement Below grade level in reading or math Grade 6* Overall attendance < 90% Absent 3 or more times from a class in a marking period 2 or more minor or major ODRs 1 or more suspensions (ISS or OSS) Course failure in English and/or math GPA < 2.0 Grade 9** Overall attendance < 90% Missed 10% or more of instructional time 3 or more absences from a class per marking period 1 or more minor or major ODRs 1 or more suspensions (ISS or OSS) 1 or more core course failures Failure to earn on-time promotion (i.e. course credits) GPA < 2.0 *6 th grade students with one of the high yield indicators have half the graduation rate. ** 9 th graders who have not shown risk factors in earlier grades may show signs at this pivotal transition year.
 Below grade level in reading or math Grade 3 Overall attendance < 90% Absent 3 or more times from school in first marking period. 2 or more minor or major ODRs 1 or more suspensions (ISS or OSS) Homework completion Needs Improvement Below grade level in reading or math Grade 6* Overall attendance < 90% Absent 3 or more times from a class in a marking period 2 or more minor or major ODRs 1 or more suspensions (ISS or OSS) Course failure in English and/or math GPA < 2.0 Grade 9** Overall attendance < 90% Missed 10% or more of instructional time 3 or more absences from a class per marking period 1 or more minor or major ODRs 1 or more suspensions (ISS or OSS) 1 or more core course failures Failure to earn on-time promotion (i.e. course credits) GPA < 2.0 *6 th grade students with one of the high yield indicators have half the graduation rate. ** 9 th graders who have not shown risk factors in earlier grades may show signs at this pivotal transition year..")
12
EWS Outcome Data - Building Level ATTENDANCE: > 90% missing more than 10% of instructional time ◦State of Ohio retrospective analysis of top/bottom 10% academic outcomes ◦Balances yield vs. accuracy BEHAVIOR: > 80% with 0 Suspensions (ISS or OSS) ◦“High Quality Instruction” research ◦MTSS Targeted Intervention COURSE PERFORMANCE: ACT-Explore Data ◦Course Failures (MTSS Model of 80% corrected for accuracy to 85-90%) ◦Credit Accrual is building-specific ◦Combinations of academic indicators can reduce graduation likelihood to 55%
 ◦ High Quality Instruction research ◦MTSS Targeted Intervention COURSE PERFORMANCE: ACT-Explore Data ◦Course Failures (MTSS Model of 80% corrected for accuracy to 85-90%) ◦Credit Accrual is building-specific ◦Combinations of academic indicators can reduce graduation likelihood to 55%.")
13
Illuminate Education On-Track Student List Report Off Track in Literacy if: Below Cut Score for AIMSweb, MEAP or the Plan/Explore Any of the EWS

14
Illuminate Education On-Track Student List Report On Track Absent fewer than 10% of course periods Warning Absent 5%-10% of class periods Off Track Absent 10% or more class periods

15
Using ACT Explore data to improve student performance

16
EXPLORE Summative, achievement assessments (not aptitude) Predictive (Explore -> Plan-> ACT-> College Ready) Based on College Readiness Standards
 Predictive (Explore -> Plan-> ACT-> College Ready) Based on College Readiness Standards")
17
College Readiness Standards What students should know and be able to do in freshman college courses. Developed based on input from colleges and high schools nationwide.

18
ACT College Readiness Benchmarks TestCollege CourseACT EnglishEnglish Composition18 MathCollege Algebra22 ReadingSocial Studies21 ScienceBiology24 College Course or Course AreaACT Subject Area Test20052013 English CompositionEnglish13 Social SciencesReading1516 College AlgebraMathematics17 BiologyScience2018

19
AIMSweb Screening Data Use students’ 8 th Grade Screening Data Tier Transition Report Group Tier Student List

20
AIMSweb within Illuminate Education ◦AIMSweb Tier Transition Report and AIMSweb Grouped Tier Student List

21
AIMSweb Tier Transition Report Switch the filters to 2013-14 to view your current 9 th graders 8 th grade screening data.

22
AIMSweb Tier Transition Report

23
AIMSweb Grouped Tier Student List Switch the filters to 2013-14 to view your current 9 th graders 8 th grade screening data.

24
AIMSweb Grouped Tier Student List

26
Data Workbook

28
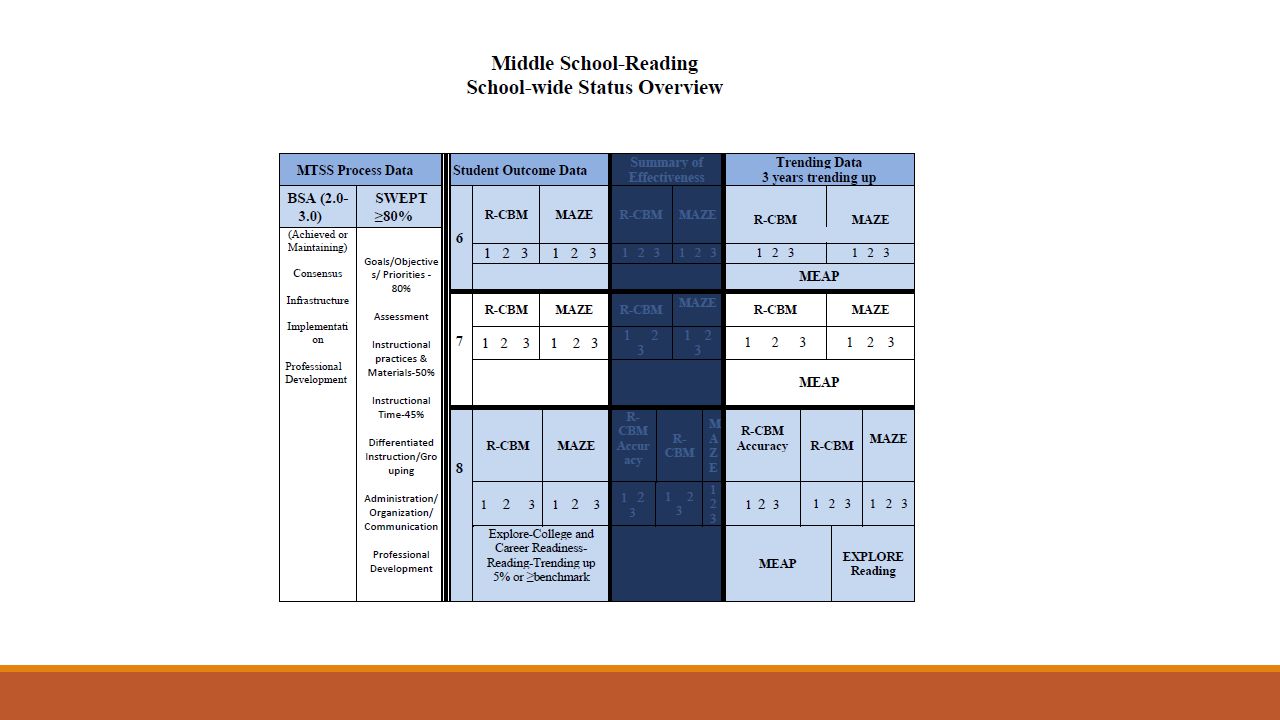
9 th Grade Student Outcome Data Process Data (May 2014) Systems (January 2014) AcademicTrend BSA (Maintaining or Achieved) Consensus Infrastructure Implementation Professional Development SWEPT (≥80%) Goals, Objective, Priorities Assessment Instructional Programs & Materials Instructional Time Differentiated Instruction/Grouping/Scheduling Administration/Organization/Communities Professional Development Course Failures (90% passing) Math English / Language Arts Trend/percentage increasing or decreasing (Student Information System) Number of students passing is increasing Yes No Credit Accrual Common Assessments (80% passing) Math English/Language Arts (Student Information System) Number of students passing is increasing Yes No Explore –College and Career Readiness Benchmark Math Reading Subgroup Performance (Student Information System) Number of students at or above the benchmark scores is increasing Yes No AIMSweb-8 th Grade Screening Data (Illuminate Education) 9 th Grade Status Overview
 Systems (January 2014) AcademicTrend BSA (Maintaining or Achieved) Consensus Infrastructure Implementation Professional Development SWEPT (≥80%) Goals, Objective, Priorities Assessment Instructional Programs & Materials Instructional Time Differentiated Instruction/Grouping/Scheduling Administration/Organization/Communities Professional Development Course Failures (90% passing) Math English / Language Arts Trend/percentage increasing or decreasing (Student Information System) Number of students passing is increasing Yes No Credit Accrual Common Assessments (80% passing) Math English/Language Arts (Student Information System) Number of students passing is increasing Yes No Explore –College and Career Readiness Benchmark Math Reading Subgroup Performance (Student Information System) Number of students at or above the benchmark scores is increasing Yes No AIMSweb-8 th Grade Screening Data (Illuminate Education) 9 th Grade Status Overview")
29
Data Workbook

30
Process Data Snapshots ACADEMICS

31
PET-M SNAPSHOTS

32
School-wide Overview- Behavior

33
Outcome Data - Behavior

35
School-wide Overview – Behavior Worked Example

36
Process Data Snapshots Behavior

37
Process Data Snapshots BEHAVIOR Benchmarks of Quality (BoQ) Tier 1 SWPBIS implementation fidelity check 53 benchmarks across 10 critical elements: Identifies areas of strength and need to inform action plans Completed annually by school leadership teams Self-Assessment Survey (SAS) Completed annually by building staff Fidelity check of PBIS implementation across (a) schoolwide, (b) non- classroom, (c) classroom, and (d) individual students Seven key elements of the Implementation Subsystems Informs of areas of strength and need, including communication
 Tier 1 SWPBIS implementation fidelity check 53 benchmarks across 10 critical elements: Identifies areas of strength and need to inform action plans Completed annually by school leadership teams Self-Assessment Survey (SAS) Completed annually by building staff Fidelity check of PBIS implementation across (a) schoolwide, (b) non- classroom, (c) classroom, and (d) individual students Seven key elements of the Implementation Subsystems Informs of areas of strength and need, including communication")
38
Process Data Snapshots: PBIS Benchmarks of Quality (BoQ)
")
39
Process Data Snapshots: PBIS Self-Assessment Survey (SAS) While summary data from the SAS provides a general sense of a building’s PBIS systems, more focused analysis can inform a team of the most vital and influential next steps. Low Implementation Status High Staff Priority PBIS Subsystem Targeted Implementation Supports

40
Process Data Snapshots: PBIS Self-Assessment Survey (SAS)
")
41
BSA-Building Self Assessment Measures: Staff Consensus Infrastructures Implementation Professional Development around the essential components of a Multi-Tiered System of Support

42
Interpreting BSA Data

43
BSA: Building Self-Assessment Snapshot Scale: Not Started (N) — In Progress (I) — Achieved (A) — Maintaining (M) — What Does BSA Data Tell you?
 — In Progress (I) — Achieved (A) — Maintaining (M) — What Does BSA Data Tell you")
44
Continuous Improvement Problem Solving Process

45
Problem Solving Guide Step 1 Determine your (first) problem to be addressed based one what you’ve derived from: Previous SIP Outcome Data Process Data and Process Data Snapshots
 problem to be addressed based one what you’ve derived from: Previous SIP Outcome Data Process Data and Process Data Snapshots")
46
Problem Solving Guide Step 2 Complete a Problem Analysis: Hypothesize what may be contributing to the problem Again, your data and the Snapshots can inform this discussion.

47
Problem Solving Guide Step 3 School Improvement Plan

48
Q. What’s new ? A. MDE Program Evaluation Tool

49
Program Evaluation Tool Why is MDE Requiring Program Evaluation? To positively impact student achievement and close gaps for the subgroups To ensure that high quality planning, implementation and evaluation are part of the Continuous Improvement Process To ensure ongoing engagement of multiple stakeholders (students, teachers, parents/community, administrators) in the planning and evaluation process To maximize the use of resources to impact student learning To provide documentation of program implementation to inform future decision-making To meet state and federal requirements.
 in the planning and evaluation process To maximize the use of resources to impact student learning To provide documentation of program implementation to inform future decision-making To meet state and federal requirements..")
50
Program Evaluation Tool MDE Schools are required to select one: strategy/reform strategy program initiative that would have the greatest impact on student achievement and close the achievement gaps.

51
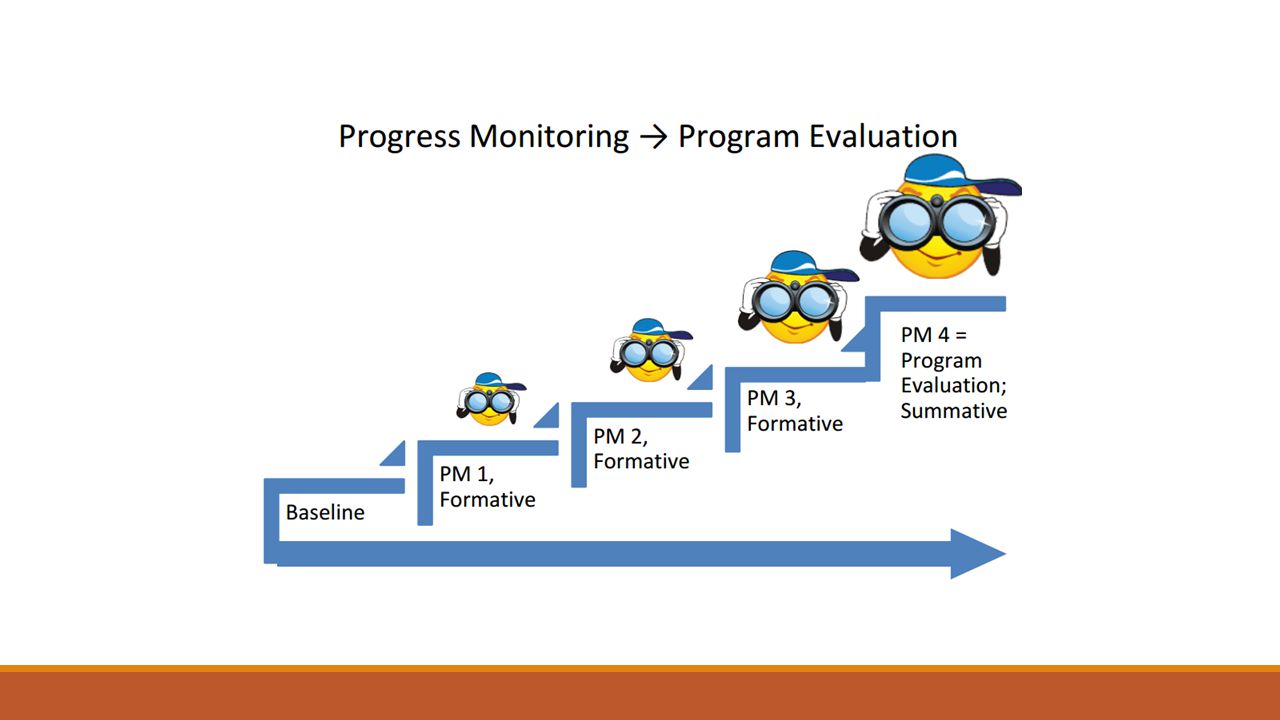
Implement the Plan Monitor the Plan Evaluate the Plan How does the MDE Program Evaluation Tool fit into the Problem Solving/Continuous Improvement Process?

55
Intentionally Plan to monitor adult actions and student outcomes How does the MDE Program Evaluation Tool fit into the Problem Solving/Continuous Improvement Process?

57
Accessing the Program Evaluation Tool Step One: Log into Assist Step Two: Click on “Portfolio” Tab Step Three: Click on Program Evaluation Tool

58
Problem Solving Guide Action Plan

59
Problem Solving Guide Step 4

60
Don’t forget to complete the…

62
Celebrate and Plan Post-It Note #1 Celebrate What’s working well? What are your successes? Include the name of your district Post-It Note #2 Plan List areas that you need assistance with or have additional questions. Include the name of your district

63
Team Time Review/update previous action plan. Use the School-wide overview sheets for problem(s) Identification Prioritize “Problems” Identify a problem; complete Continuous Improvement Process process and create an action plan. Move on to second (and third) problem, if able Identify building Glows and Grows Complete the Communication Plan You do!
 Identification Prioritize Problems Identify a problem; complete Continuous Improvement Process process and create an action plan. Move on to second (and third) problem, if able Identify building Glows and Grows Complete the Communication Plan You do!.")
64
Questions? Please email questions to Mary Jo Wegenke: mwegenke@inghamisd.org

Similar presentations


 E-12>")


 Education Commission of the States June 27, 2013 Virginia Department of Education.>")


