Download presentation
Presentation is loading. Please wait.

1
Beyond GDP Measuring social progress in Europe Koen Decancq – Erik Schokkaert Frankfurt June 2013

2
Introduction Recent interest in going “beyond GDP” This paper: how can (should) we measure social progress? Answer on three levels: 1.Principles for a measure of social progress 2.A specific proposal: equivalent income. 3.Illustration: well-being and social progress in Europe between 2008 and 2010.

3
Outline 1.Principles for a measure of social progress. 2.A specific proposal: equivalent income. 3.Illustration: well-being and social progress in Europe between 2008 and 2010.

4
Principle 1: focus on individual well-being The ultimate criterion to evaluate social progress is the well-being of individuals making up a society. Quid future generations? Sustainability as restriction to be imposed on present generations.

5
Principle 2: focus on outcomes Information must be collected on the different dimensions of life that are important for the well- being of individual citizens. Well-being is not fully determined by income or material consumption. Other dimensions of life are essential (e.g. health, quality of social interactions and of the natural environment, safety, … ). Development of lists of specific policy indicators is a different issue. We focus on “outputs” rather than on “inputs”.
. Development of lists of specific policy indicators is a different issue. We focus on outputs rather than on inputs ..")
6
Two examples

7
Principle 3: accounting for cumulative deprivation incomehealth“well-being” individual 11001055 individual 21010055 average55 ratio10/1 1/1 incomehealth“well-being” individual 1100 individual 210 average55 ratio10/1

8
Principle 3: accounting for cumulative deprivation Accounting for cumulative deprivation requires that one first constructs an index of well-being at the individual level and then aggregates these well-being indices across individuals. Compare with the HDI … … and MPI

9
Principle 4: Respect for individual ideas about a good life The weighting scheme applied to construct the measure of individual well-being should respect the individual ideas about what is a good life. This discards the use of objective indicators, such as the Human Development Index, MPI, …

10
Principle 4: Respect for individual ideas about a good life Reluctance towards “indicator aggregation” (Eurostat, 2011) is easily understandable if one aims at defining trade-offs at the aggregate level. Weights are arbitrary. At the level of individual evaluation, however, different dimensions of life are commensurable. In daily life, we continuously trade off life dimensions.

11
Principle 5: avoidance of physical-condition neglect Then why not use “happiness”? Because it does not respect individual ideas about the good life! –“A person who is ill-fed, undernourished, unsheltered and ill can still be high up in the scale of happiness or desire-fulfillment if he or she has learned to have ‘realistic’ desires and to take pleasure in small mercies” (Sen, 1985). Much evidence on adaptation in the empirical literature. Happiness or (subjective life satisfaction) may be one of the important dimensions of life, but it should not be seen as an encompassing measure of individual well-being.
. Much evidence on adaptation in the empirical literature. Happiness or (subjective life satisfaction) may be one of the important dimensions of life, but it should not be seen as an encompassing measure of individual well-being..")
12
Principle 6: inequality aversion Justice requires accounting for inequality in individual well-being.

13
Outline 1.Principles for a measure of social progress. 2.A specific proposal: equivalent income. 3.Illustration: well-being and social progress in Europe between 2008 and 2010.

14
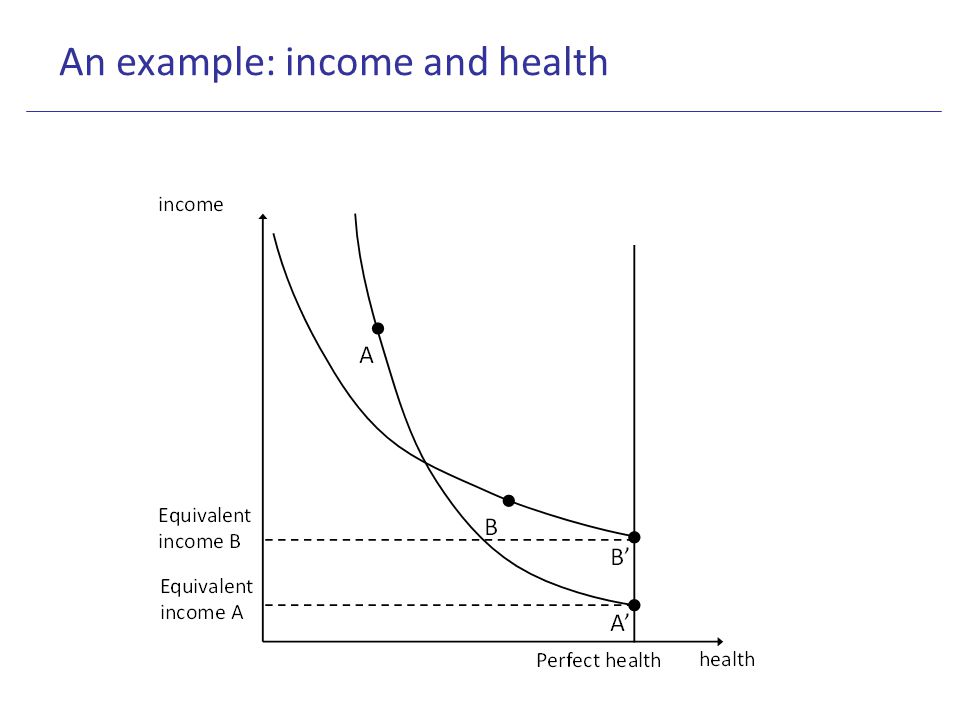
A specific proposal: Equivalent incomes Fix reference values for all the non-income dimensions. Equivalent income = the hypothetical income that, if combined with the reference value on all non- income dimensions, would place the individual in a situation that she finds equally good as her actual situation.

15
An example: income and health

20
Pros (and cons) of equivalent incomes Equivalent income = actual income minus the welfare loss incurred on the non-income dimensions (measured as willingness-to-pay). Satisfies all our basic principles. Measurable in money terms, can be introduced in any social welfare, inequality or poverty measure.

21
(Pros and) cons of equivalent incomes Less intuitive than happiness or HDI – but these approaches do not satisfy our basic principles. Choice of reference values: An ethical question (not psychological!) More information is needed about “preferences” (or WTP) –Stated preferences: Contingent valuation surveys (environment, health). –Revealed preference: estimate from observed choices and behaviour. –Derive information about willingness-to-pay from life satisfaction questions.
 More information is needed about preferences (or WTP) –Stated preferences: Contingent valuation surveys (environment, health). –Revealed preference: estimate from observed choices and behaviour. –Derive information about willingness-to-pay from life satisfaction questions..")
22
Outline 1.Principles for a measure of social progress. 2.A specific proposal: equivalent income. 3.Illustration: well-being and social progress in Europe between 2008 and 2010.

23
Social Progress in Europe: An illustration European Social Survey, 2008 and 2010. (SILC does not contain a question on life satisfaction). 18 countries: 15 EU-members, Switzerland, Norway, the Russian Federation. About 52,000 individual observations. Dimensions:
. 18 countries: 15 EU-members, Switzerland, Norway, the Russian Federation. About 52,000 individual observations. Dimensions:.")
24
Estimating preference differences Assumption: preferences do not differ between different countries. Different groups have different preferences:

25
Income, equivalent income, happiness (2010) IncomeEquivalent incomeHappiness (NO, CH) (DK, CH) DE28986(6)3272(10)7.26(9) DK28162(7)6915(4)8.35(1) FR25779(10)3604(9)6.34(15) ES22282(11)3245(11)7.30(8) GR19388(13)2547(12)5.71(17) (RU, EE)(RU, HU)(GR, RU)
 IncomeEquivalent incomeHappiness (NO, CH) (DK, CH) DE28986(6)3272(10)7.26(9) DK28162(7)6915(4)8.35(1) FR25779(10)3604(9)6.34(15) ES22282(11)3245(11)7.30(8) GR19388(13)2547(12)5.71(17) (RU, EE)(RU, HU)(GR, RU)")
26
Inequality (2010) Gini coefficient (income)Gini coefficient (equivalent income) (CZ, SE)(NO, DK) CZ0.27(1)0.73(10) DK0.28(3)0.64(2) HU0.30(6)0.76(17) SI0.32(9)0.75(15) CH0.34(14)0.65(3) GB0.36(16)0.71(9) GR0.36(17)0.75(13) ES0.38(18)0.74(12) (GR, ES)(HU, EE)
 Gini coefficient (income)Gini coefficient (equivalent income) (CZ, SE)(NO, DK) CZ0.27(1)0.73(10) DK0.28(3)0.64(2) HU0.30(6)0.76(17) SI0.32(9)0.75(15) CH0.34(14)0.65(3) GB0.36(16)0.71(9) GR0.36(17)0.75(13) ES0.38(18)0.74(12) (GR, ES)(HU, EE)")
27
Social welfare (2010) Income ( = 0)Income ( = 5) Equivalent income ( = 5) (NO, CH)(NO, SE)(NO, CH) GB29794(5)11262(9)281(7) DE28986(6)12754(7)180(10) DK28162(7)13828(5)595(4) BE27477(8)13299(6)390(5) ES22282(11)8668(13)156(11) GR19388(13)7716(14)115(12) CZ16729(14)8983(11)89(14) (RU, EE)(EE, RU)(RU, HU)
 Income ( = 0)Income ( = 5) Equivalent income ( = 5) (NO, CH)(NO, SE)(NO, CH) GB29794(5)11262(9)281(7) DE28986(6)12754(7)180(10) DK28162(7)13828(5)595(4) BE27477(8)13299(6)390(5) ES22282(11)8668(13)156(11) GR19388(13)7716(14)115(12) CZ16729(14)8983(11)89(14) (RU, EE)(EE, RU)(RU, HU)")
28
Yearly growth rates (2008-2010) income growth ( =0) Equivalent income growth ( =5) (CH, PL)(CH, RU) CH+ 7.35%(1)+11.18%(1) DE+ 0.09%(3)- 4.19%(9) BE- 0.55%(4)+ 6.21%(3) DK- 1.73%(8)-4,64%(10) ES- 2.24%(11)-11,19%(17) GR- 5.81%(17)-21,72%(18) EE- 8.60%(18)-9,29%(15) (GR, EE)(ES, GR)
 income growth ( =0) Equivalent income growth ( =5) (CH, PL)(CH, RU) CH+ 7.35%(1)+11.18%(1) DE+ 0.09%(3)- 4.19%(9) BE- 0.55%(4)+ 6.21%(3) DK- 1.73%(8)-4,64%(10) ES- 2.24%(11)-11,19%(17) GR- 5.81%(17)-21,72%(18) EE- 8.60%(18)-9,29%(15) (GR, EE)(ES, GR)")
29
Conclusion 1.We strongly believe in the basic principles. Debate should be about their ethical foundation. 2.The equivalent income is an interesting concept, but there may be other approaches. 3.Our empirical illustration is only meant to be an illustration, but interesting findings Data need: introduce questions on “willingness-to pay” or satisfaction with life on a regular basis in SILC.

Similar presentations


 workshop on Development.>")


